dependency-graph is a command-line utility to show the dependencies between SLEE components in a running SLEE.
It can either list them to the console (useful with grep), or write a DOT file for use with Graphviz.
To use it, call the dependency-graph script in the rhino/client/bin directory (dependency-graph.bat for Windows users).
Prerequisites |
|
||
|---|---|---|---|
Options |
Invoke with no arguments to view command-line options: bin$ ./dependency-graph Valid command line options are: -h <host> - The hostname to connect to. -p <port> - The port to connect to. -u <username> - The user to authenticate as. -w <password> - The password used for authentication. -D - Display connection debugging messages. Exactly one of the following two options: -c - Write the dependencies to the console. -o <output> - Draws the graph to the given output file in "DOT" format (see: http://en.wikipedia.org/wiki/DOT_language). Graph options only (when using -o option): -e - Exclude events. -f - Write full component IDs (including vendor and version). -g - Group by deployable unit. -m - Monochrome (turn colors off). Exactly one of -c or -o should be specified. |
||
Examples |
Below are some example sessions against a RhinoSDK with the SIP examples installed. They illustrate how the level of detail can be controlled using the command-line flags. With -e, -f, -g flags
$ cd rhino/client/bin
bin$ ./dependency-graph -o sip-dependencies.dot -e -f -g
Connecting to localhost:1199
Fetching dependency info from SLEE...
Processing dependencies...
Writing dependency graph in DOT format to sip-dependencies.dot...
Finished generating file.

If you have graphviz installed, this command should generate a PNG image file:
    dot -Tpng sip-dependencies.dot -o sip-dependencies.dot.png
bin$ dot -Tpng sip-dependencies.dot -o SipExamples-EFG.png
This excludes events ( 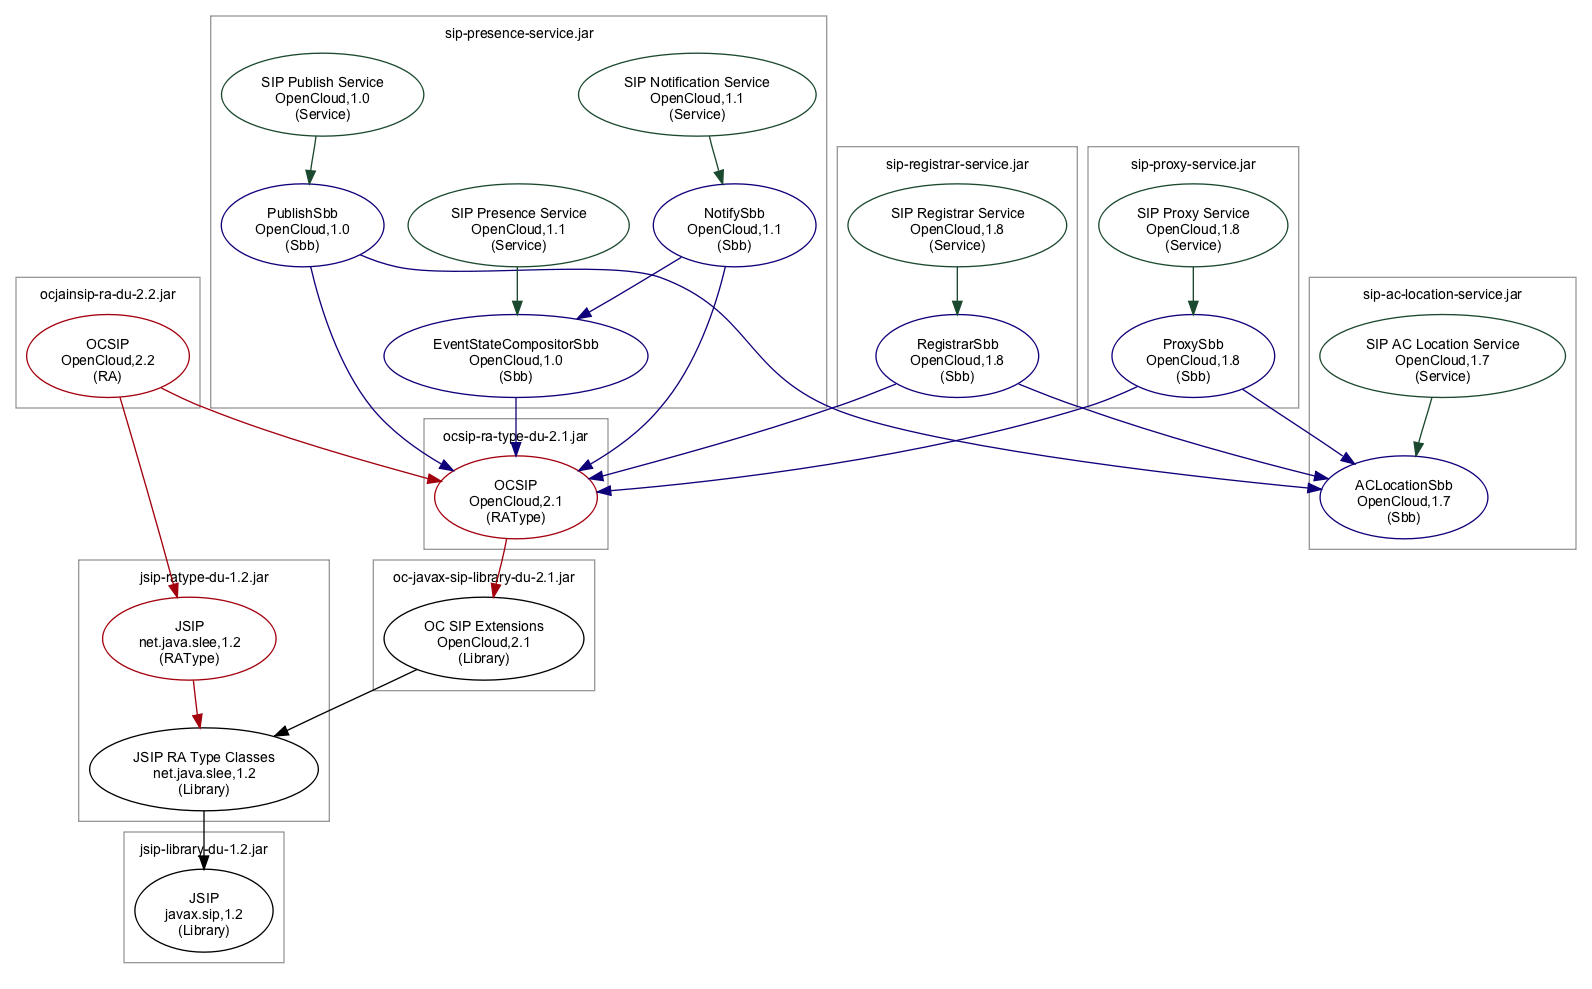
Just -f and -g
This is the equivalent graph after dropping the ( $ ./dependency-graph -o sip-dependencies.dot -f -g ... $ dot -Tpng sip-dependencies.dot -o SipExamples-most-detail.png 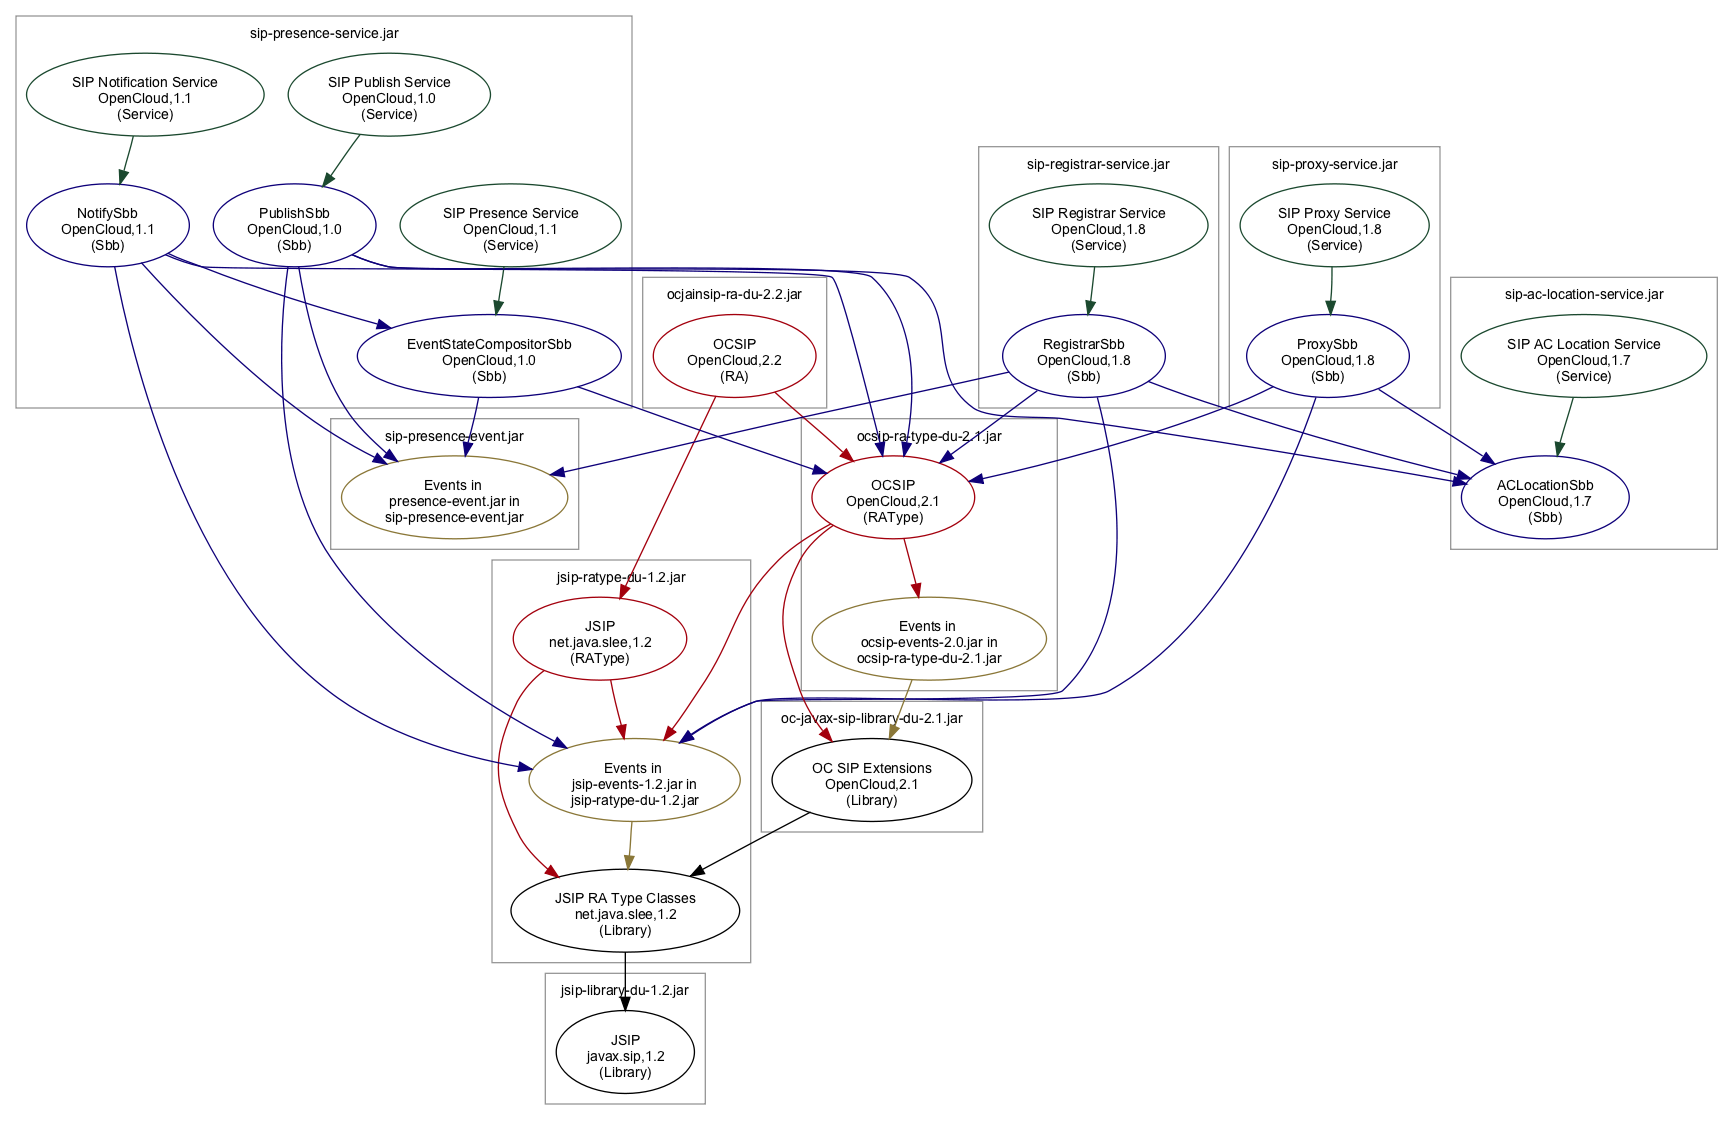
Just -e
This is the equivalent graph with the least detail possible, using just the ( $ ./dependency-graph -o sip-dependencies.dot -e ... $ dot -Tpng sip-dependencies.dot -o SipExamples-least-detail.png 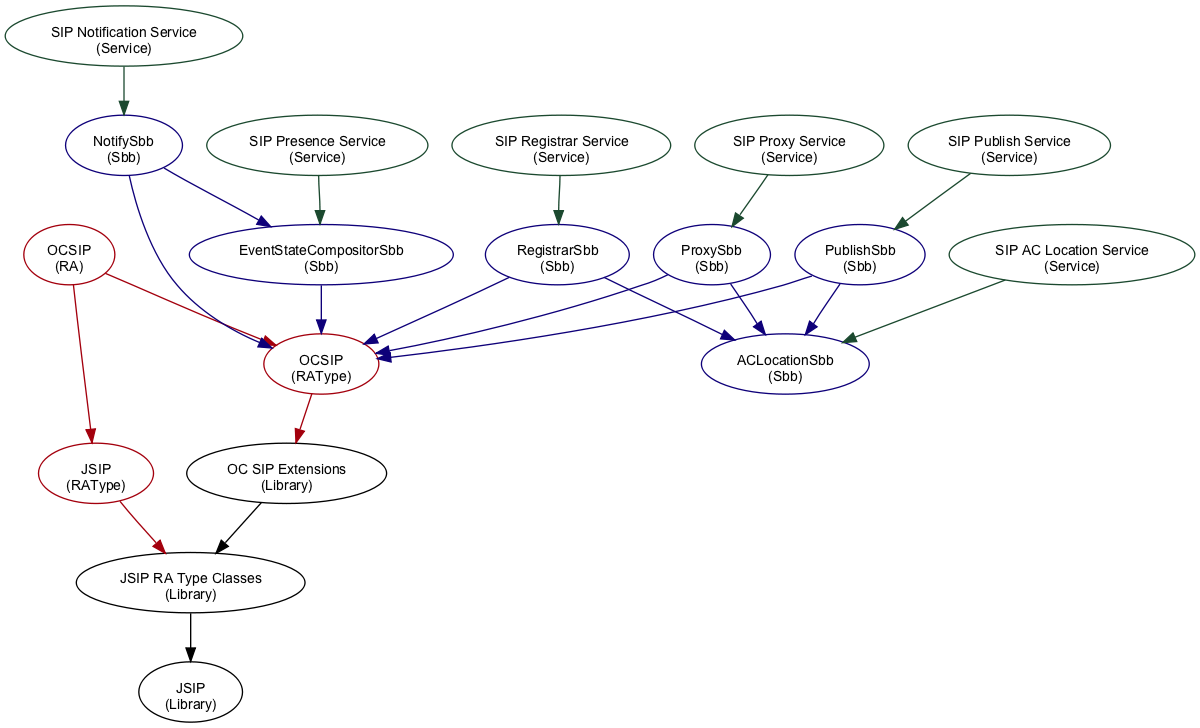
|
