Tools for annotating and displaying the log, and a command line

The Element Manager comes with tools for annotating the REM log, opening a command-line interface, and displaying the audit log.

Log Controls

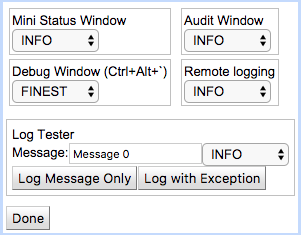
REM sends log messages to four destinations:

  • Mini Status Window — the pane at the bottom of REM pages

  • Audit Window — the Audit Log page

  • Debug Window — the debug log; display by pressing Ctrl+Alt+` or from the Audit Log page

  • Remote logging — logs that go to the server, to be written to the server log.

To control log levels for the four destinations:

1

From the Monitoring Dashboard, select Tools > Log Control.
Log control options display.
logcontrol

2

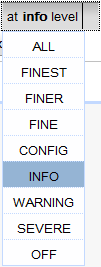
Click to select a particular handler level.
A popup menu displays.

logginglevels

  • Click to select a logging level.
    CAUTION: REM maps levels FINE, FINER, and FINEST to the DEBUG level on the server — so to see them on the server, the log level for the rem.client logger in the server-side logging configuration must also be changed in the log4j.properties (it defaults to INFO).

3

To see how each of the four handlers treats a log message at a particular level: * Enter it in the Message field, and click Log Message Only or Log with Exception.
Results displays in the message area at the bottom of the page.

4

When you are done controlling logging options, click Done.
The log control window closes.

Annotate Rhino Log

To manually add a message to the Rhino log:

1

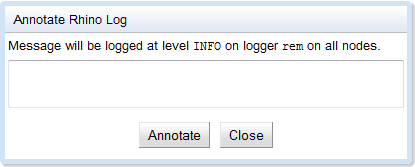
From the Monitoring Dashboard, select Tools > Annotate Rhino Log.
An Annotate Rhino Log dialog box displays.
annotate

2

Enter your message, and click Annotate.
REM adds the message to at level INFO, on logger rem, on all nodes.

Command Line

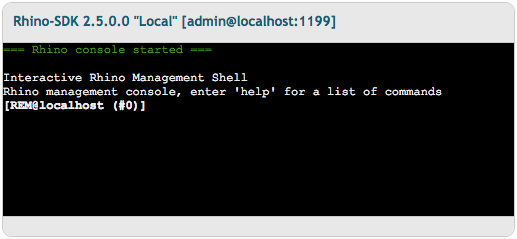
REM provides a command-line interface, identical to the rhino-console.

To use the REM command-line interface:

1

From the Monitoring Dashboard, select Tools > Command Line.
The command-line interface displays.
commandline

2

Enter Rhino console commands.

Full help is available online.

Audit Log

Use this option to view the audit log in the main area of the screen (instead of just at the bottom):

To clear the log display, click clearlog (at left).

The log area clears.

You can also access the debug window from here by clicking the icon in the upper right corner of the audit log.

Previous page Next page