This book contains performance benchmarks using Sentinel VoLTE for a variety of scenarios and cluster configurations.
It contains these sections:
-
Test Methodology — details of methods used for benchmarks
-
Benchmark Scenarios — the call flows for each of the benchmark scenarios
-
Hardware and Software — details of the hardware, software, and configuration used for the benchmarks
-
Benchmark Results — summaries of the benchmarks and links to detailed metrics.
For more information:
-
review the other Sentinel VoLTE documentation available, especially the Sentinel VoLTE Administration Guide
-
for documentation on the other OpenCloud products used in the benchmarks, see the OpenCloud DevPortal.
Test Methodology
This page describes the methodology used when running the benchmarks.
Rationale
Benchmarks were performed using simulated network functions, and a real VoLTE cluster. The simulated network functions are run on separate physical hosts from the VoLTE cluster. The network functions (HSS, OCS, SCSCF) were simulated to abstract away performance considerations for these functions.
In our benchmarks the VoLTE cluster processed calls for both originating and terminating triggers. Each call is processed in exactly one trigger — either originating or terminating.
-
50% of calls are originating (VoLTE full preconditions)
-
50% of calls are terminating (All other callflows)
Benchmarks were run at 50% of maximum sustainable load level. This provides good call setup times (approximately 15 milliseconds), and allows for up to half a cluster to fail without causing cascading failures.
| |
Call rate is determined per physical host, not per Rhino node. |
Callflows
A representative sample of commonly invoked MMTEL features were used to select the callflows, for these scenarios:
| |
For the full callflows, see Benchmark Scenarios. |
Each test runs a total of x sessions per second, across all callflowsL
| Scenario | Percentage |
|---|---|
VoLTE full preconditions |
50% |
CDIV Success-response |
40% |
CDIV Success-response with OIP |
5% |
CDIV-busy-response |
5% |
Call setup time (latency) is measured by the simulator playing the initiating role. For all CDIV scenarios, latency is measured from INVITE to final response. For the preconditions scenario, latency is measured from INVITE to 180.
Numa architecture
Most commercial off-the-shelf systems available currently have a non-uniform memory architecture (NUMA). In NUMA, memory access times are not equal for all sockets and all memory locations. Memory access is fastest for memory directly attached to the socket. The JAVA virtual machine does not provide any mechanisms for controlling where memory is allocated on a NUMA machine.
NUMA combined with the JVM has significant implications for performance. The best performance can be achieved by always NUMA binding each Rhino node to a single socket. In all cases this provides better performance, and greater tolerance of node failure.
All hosts used for benchmarks have 2 CPUs using NUMA. 1-node-per-host test configurations do not use NUMA bindings. 2-node-per-host test configurations use NUMA binding to restrict each node to 1 CPU.
Cluster configurations
These configurations were tested:
-
1 VoLTE node on 1 host machine
-
2 VoLTE nodes on 1 host machine
-
2 VoLTE nodes on 2 host machines
-
4 VoLTE nodes on 2 host machines.
| |
All hosts are physical machines. Virtualisation is not used. |
Test setup
Each test includes a ramp-up period of 15 minutes before full load is reached. This is included as the Oracle JVM provides a Just In Time (JIT) compiler. The JIT compiler compiles Java bytecode to machinecode, and recompiles code on the fly to take advantage of optimizations not otherwise possible. This dynamic compilation and optimization process takes some time to complete. During the early stages of JIT compilation/optimization, the node cannot process full load. JVM garbage collection does not reach full efficiency until several major garbage collection cycles have completed.
15 minutes of ramp up allows for several major garbage collection cycles to complete, and the majority of JIT compilation. At this point, the node is ready to enter full service.
The tests are run for one hour after reaching full load. Load is not stopped between ramp up and starting the test timer.
Benchmark Scenarios
The VoLTE benchmarks use four representative MMTEL scenarios, run repeatedly and simultaneously.
| |
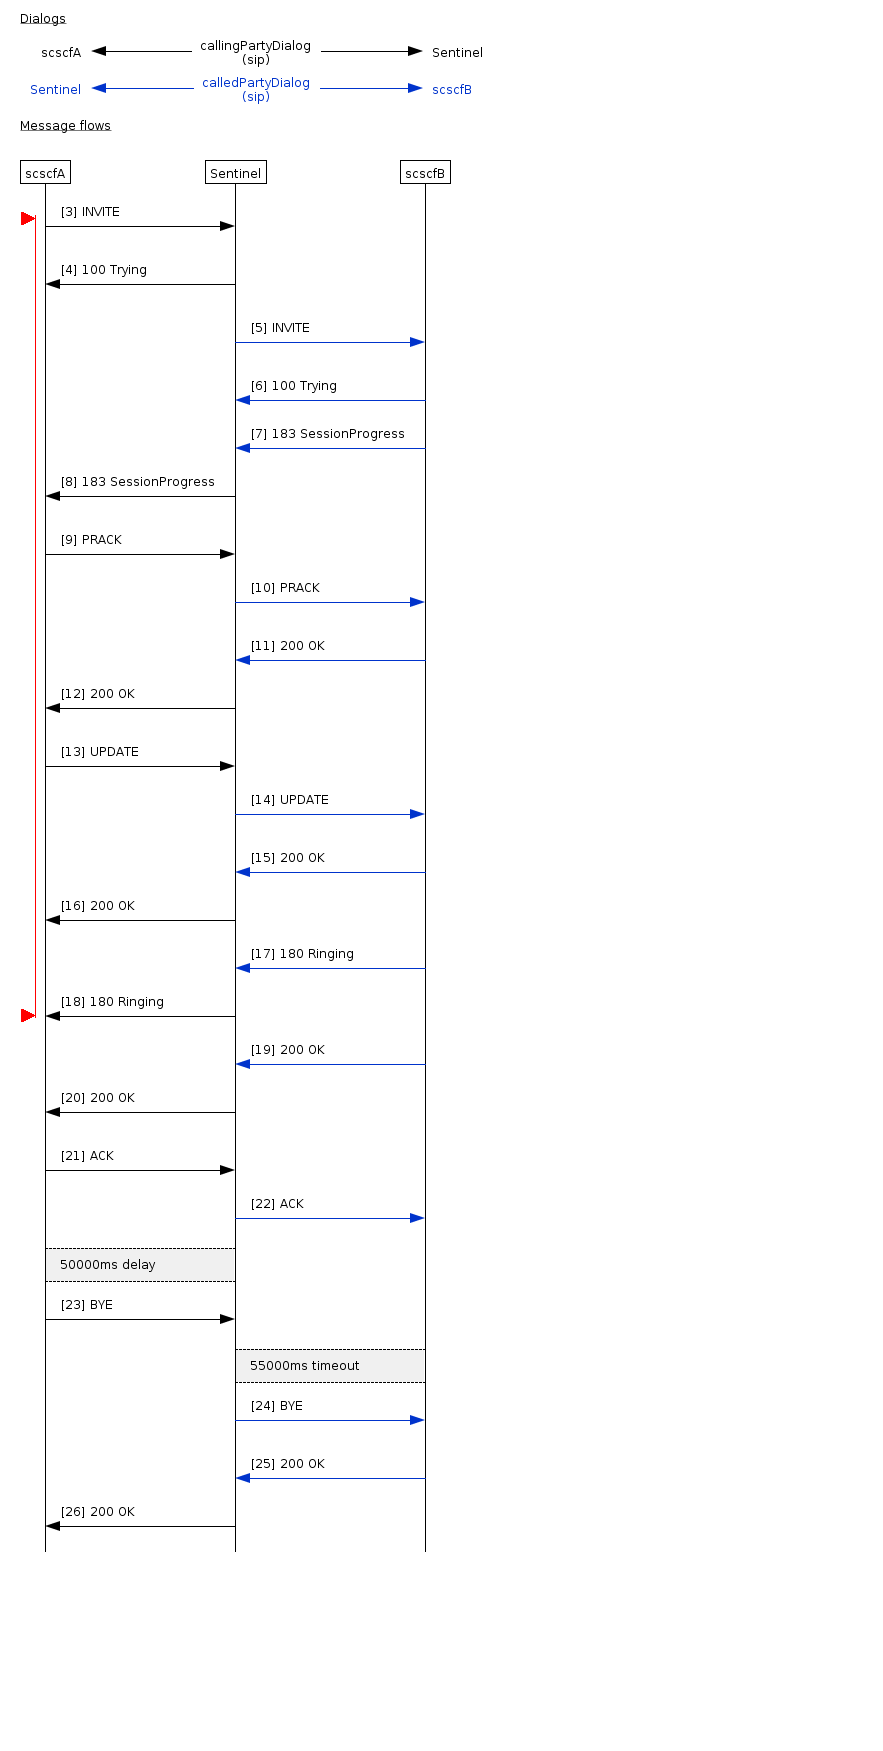
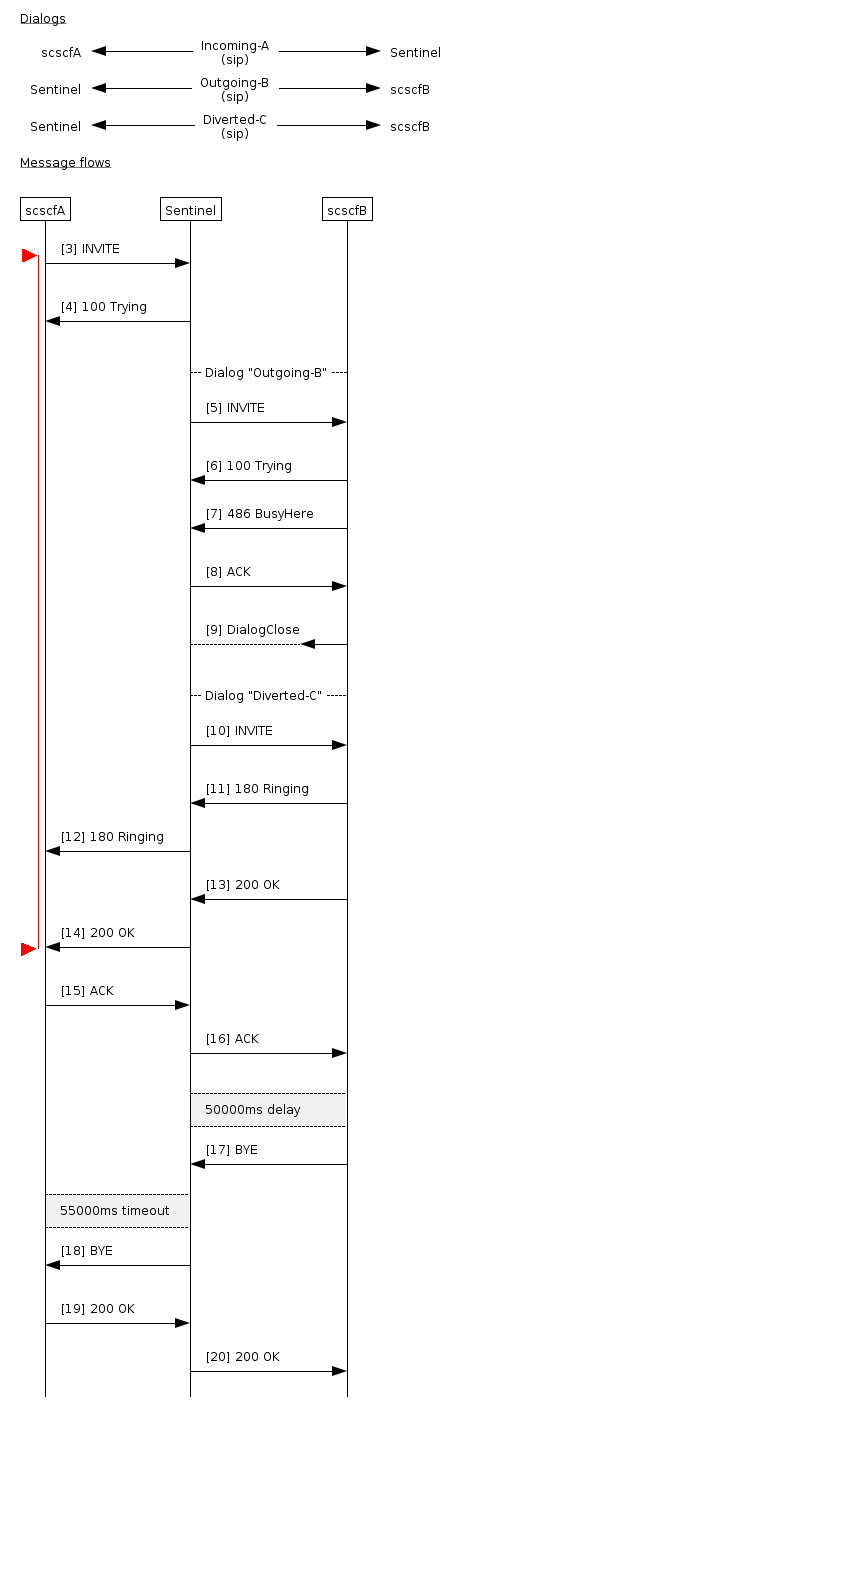
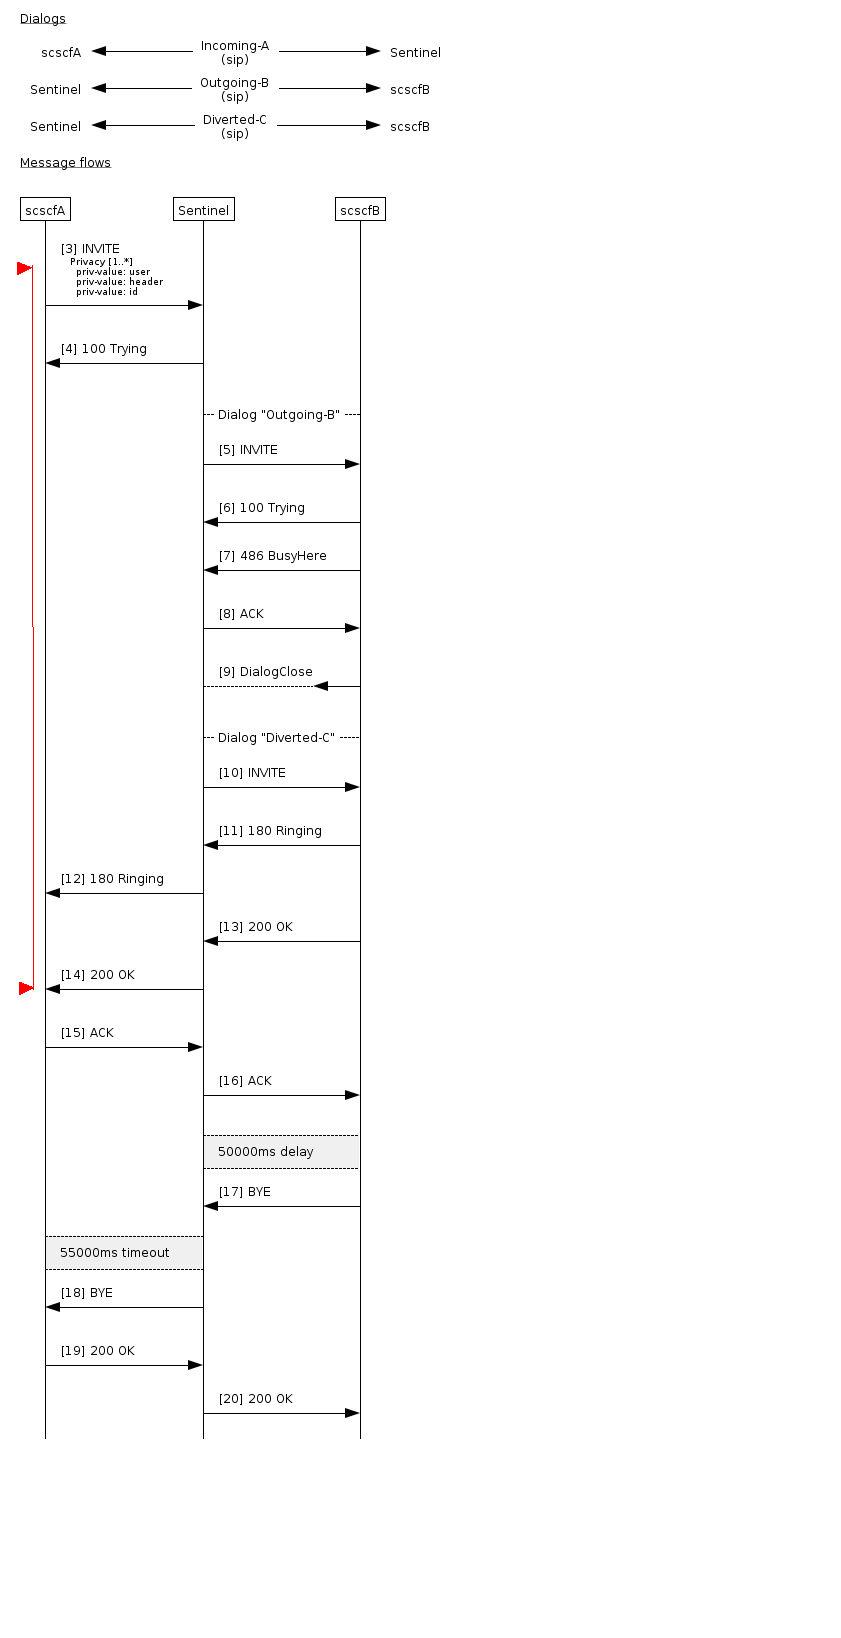
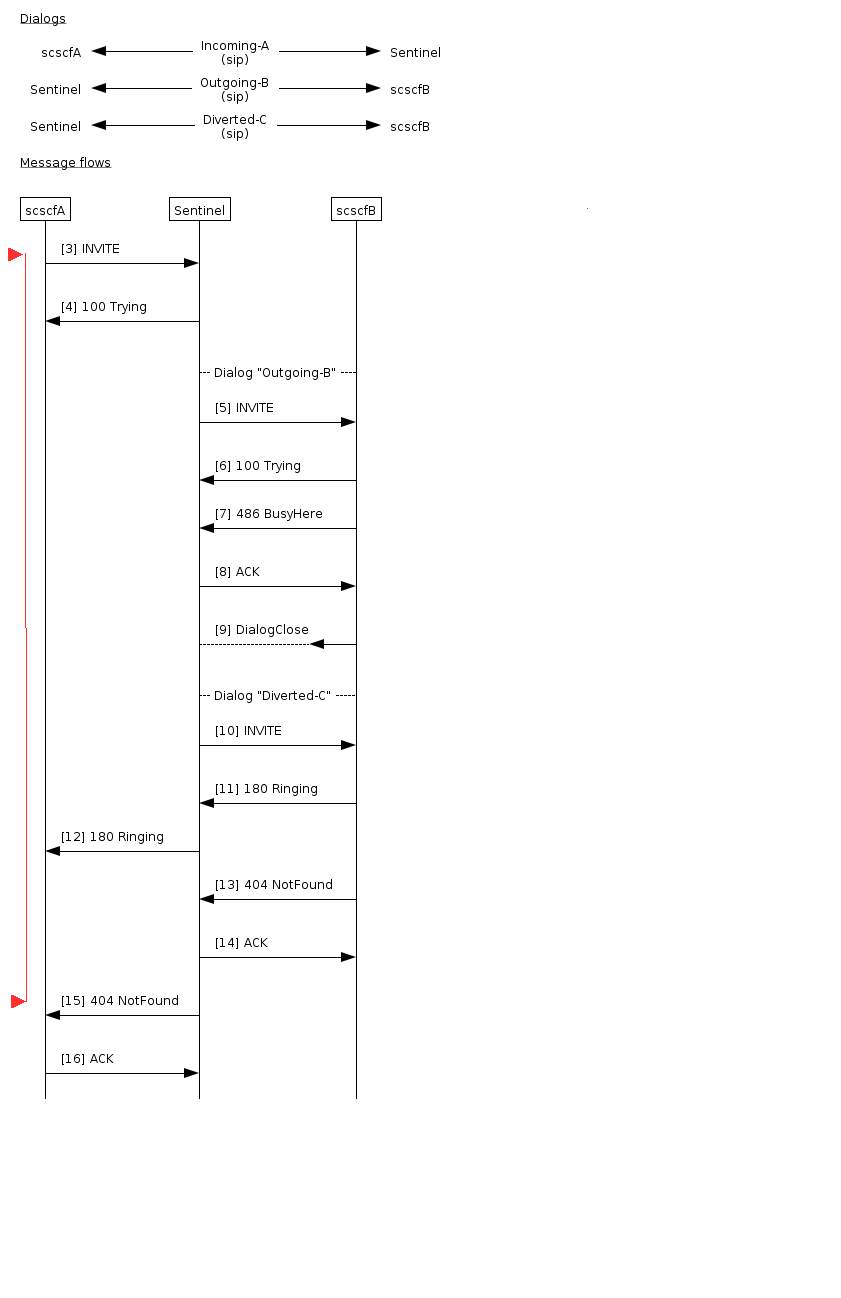
Red lines in callflow diagrams mark the points call setup time is measured between. |
VoLTE full preconditions
A basic VoLTE call, with no active MMTEL features. Radio bearer quality of service preconditions are used.
CDIV Success-response
Callflow with Call Diversion active. B party rejects call, call is diverted to C party, C party accepts call, call lasts 50 seconds.
Hardware and Software
This page describes the hardware and software used when running the benchmarks.
Sentinel VoLTE hosts
Logical Processor Count |
24 |
CPU Count |
2 |
Cores per CPU |
6 |
CPU Vendor |
Intel |
CPU Type |
Intel® Xeon® CPU X5660@2.80GHz |
Total RAM |
24,016M |
| |
Benchmarks with two hosts used two identical servers |
Operating System |
CentOS 6.6 |
Kernel Version |
Linux 2.6.32-504.8.1.el6.x86_64 |
Platform |
64-bit |
| Vendor | Software | Version |
|---|---|---|
Oracle |
1.7.0_71-b14 |
|
OpenCloud |
2.6.0.1 |
|
OpenCloud |
2.5.0.1-M4 |
|
OpenCloud |
1.5.4.1 |
|
OpenCloud |
2.5.4.1 |
Simulators
Logical Processor Count |
24 |
CPU Count |
2 |
Cores per CPU |
6 |
CPU Vendor |
Intel |
CPU Type |
Intel® Xeon® CPU X5650@2.67GHz |
Total RAM — single host benchmark |
24,016M |
Total RAM — two-host benchmark |
36,047M |
Operating System |
Red Hat 7.2 |
Kernel Version |
Linux 3.10.0-327.28.3.el7.x86_64 |
Platform |
64-bit |
| Vendor | Software | Version |
|---|---|---|
Oracle |
1.7.0_71-b14 |
|
OpenCloud |
2.3.0.10 |
|
OpenCloud |
1.5.4.0 |
|
OpenCloud |
1.0.3-TRUNK.0-M4 |
|
OpenCloud |
2.6.0.3 |
Rhino configuration
JVM_ARCH=64
HEAP_SIZE=12,288m
MAX_NEW_SIZE=3,072m
NEW_SIZE=3,072m
PERMGEN_SIZE=384m
JVM_ARCH=64
HEAP_SIZE=6,656m
MAX_NEW_SIZE=1,664m
NEW_SIZE=1,664m
PERMGEN_SIZE=384m
ReplicatedMemoryDatabase committed-size = 400M
DomainedMemoryDatabase committed-size = 400M
ProfileDatabase committed-size = 400M
LocalMemoryDatabase committed-size = 400M
Benchmark Results
A summary of the benchmark results follows. Click on a benchmark name for detailed results.
| Benchmark | Rate | CPU Usage | NUMA state | ||||||||||||
|---|---|---|---|---|---|---|---|---|---|---|---|---|---|---|---|
|
275 calls per second |
|
NUMA bindings not used |
|||||||||||||
|
275 calls per second |
|
NUMA bindings used. CPU usage and call setup times improved over One Host with One Node |
|||||||||||||
|
550 calls per second |
|
NUMA bindings not used |
|||||||||||||
|
550 calls per second |
|
NUMA bindings used. Call setup times improved over Two Hosts with One Node per Host |
One Host with One Node
This page summarises the results for benchmarks executed with a single host running a single node. Detailed metrics follow the summary tables.
Benchmarks
|
Call rate |
275 calls per second across the four scenarios |
||||||||
|
|||||||||
|
Scenario latencies
| Scenario | 50th | 90th | 95th | 99th |
|---|---|---|---|---|
13.6ms |
22.7ms |
132.0ms |
295.0ms |
|
10.6ms |
18.3ms |
123.0ms |
286.0ms |
|
13.7ms |
20.2ms |
129.0ms |
291.0ms |
|
15.9ms |
30.6ms |
152.0ms |
311.0ms |
| |
Callflows for each of the scenarios are available in Benchmark Scenarios. |


One Host with Two Nodes
This page summarises the results for benchmarks executed with a single host running two nodes. Detailed metrics follow the summary tables.
Benchmarks
|
Call rate |
275 calls per second across the four scenarios |
||||||||||
|
|||||||||||
|
Scenario latencies
| Scenario | 50th | 90th | 95th | 99th |
|---|---|---|---|---|
11.8ms |
14.6ms |
22.9ms |
173.0ms |
|
11.7ms |
13.5ms |
23.7ms |
174.0ms |
|
11.9ms |
14.9ms |
23.9ms |
175.0ms |
|
17.4ms |
19.8ms |
34.1ms |
186.0ms |
| |
Callflows for each of the scenarios are available in Benchmark Scenarios. |


Two Hosts with One Node per Host
This page summarises the results for benchmarks executed with two hosts, each running a single node. Detailed metrics follow the summary tables.
Benchmarks
|
Call rate |
550 calls per second across the four scenarios |
||||||||||
|
|||||||||||
|
Scenario latencies
| Scenario | 50th | 90th | 95th | 99th |
|---|---|---|---|---|
10.8ms |
18.7ms |
79.0ms |
188.0ms |
|
10.7ms |
18.7ms |
79.1ms |
187.0ms |
|
10.9ms |
18.1ms |
78.2ms |
187.0ms |
|
16.1ms |
27.0ms |
96.7ms |
203.0ms |
| |
Callflows for each of the scenarios are available in Benchmark Scenarios. |


Two Hosts with Two Nodes per Host
This page summarises the results for benchmarks executed with two hosts, each running two nodes. Detailed metrics follow the summary tables.
Benchmarks
|
Call rate |
550 calls per second across the four scenarios |
||||||||||||||
|
|||||||||||||||
|
Scenario latencies
| Scenario | 50th | 90th | 95th | 99th |
|---|---|---|---|---|
12.1ms |
15.0ms |
36.7ms |
172.0ms |
|
12.0ms |
14.7ms |
36.2ms |
172.0ms |
|
12.2ms |
15.3ms |
38.2ms |
174.0ms |
|
18.0ms |
21.7ms |
48.2ms |
186.0ms |
| |
Callflows for each of the scenarios are available in the Benchmark Scenarios. |


