With each major release of the Rhino TAS, Metaswitch provides a standard set of benchmark data.
We measure platform performance in realistic telecommunications scenarios so the results are genuine and reliable.
The benchmarks
| |
PROPRIETARY AND CONFIDENTIAL
Rhino benchmark information on these pages is proprietary and confidential. Do not reproduce or present in any fashion without express written consent from Metaswitch. |
Other documentation for the Rhino TAS can be found on the Rhino TAS product page.
IN benchmarks
Below is an overview of how we test Rhino performance with IN, followed by links to the benchmarks.
About the IN test scenario
To test the IN performance of Rhino we use a Virtual Private Network (VPN) application, which:
-
provides number-translation and call-barring services for groups of subscribers
-
uses the CAPv3 protocol for call-control, and MAPv3 for location information
-
uses Metaswitch’s CGIN APIs and resource adaptor to provide CAP and MAP support.
Metaswitch developed this VPN application to meet genuine business requirements from a Tier-1 network operator, giving us genuine benchmarks — instead of, for example, using a trivial demo application.
This test application performs functions that are common to many real-world IN applications:
-
monitoring the entire call, and reliably maintaining state for the duration of the call
-
interacting with external systems (MSC, HLR, call detail records)
-
supporting a large subscriber database.
The VPN application
The VPN application provides number-translation and call-barring services for groups of subscribers. It uses CAPv3 for call-control and MAPv3 for location information.
| If the A party… | then VPN responds with: |
|---|---|
|
…has called a B party in their own VPN using short code or public number |
|
|
…and B party are not in the same VPN |
|
|
…dials a short code that doesn’t exist |
|
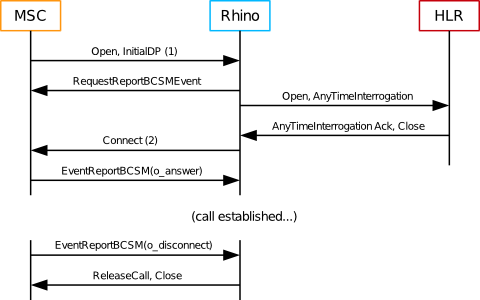
Call flow
This benchmark uses only the VPN service’s Connect with DRA call handling path, as described above. Some of the incoming call-screening and outgoing call-screening rules applied by the VPN application require location information and involve a MAP query of the HLR. This results in the application making ATI queries to the HLR for 10% of the dialogs initiated by the MSC.
| |
Measuring call setup time
|
IN benchmark environment and configuration
Below are the hardware, software, and Rhino configuration used for the Rhino IN benchmarks.
Hardware
The IN benchmark tests were run using both one- and two-node Rhino clusters.
Each Rhino node is run on its own host. Simulators for the MSC and HLR are run on their own hosts, with horizontal scaleout to properly load the Rhino nodes.
Rhino’s CGIN resource adaptor requires an external TCAP stack to communicate with SS7 networks. Metaswitch’s OCSS7 stack was used for this benchmark, with two OCSS7 SGC clusters, each with two nodes within the cluster. Rhino was connected to one SGC cluster, and the simulators were connected to the other SGC cluster. Each OCSS7 SGC node ran on its own VM.
All machines used for benchmarking are provided by Amazon’s EC2 public cloud. We use exclusively c5d.2xlarge instances as described here. The c5d.2xlarge instance type has 8 vCPU (hardware threads) and 16 GiB of RAM, with up to 10 Gbps networking. Of particular note here, there are two generations of Intel hardware which may be used for any instance, entirely at Amazon’s discretion.
Software
The IN benchmark tests used the following software.
| Software | Version |
|---|---|
Java |
Oracle Corporation OpenJDK 64-Bit Server VM 11.0.7+10-LTS |
Rhino |
3.0.0.3 |
3.0.0.0 |
|
4.0.0.0 |
Rhino configuration
For the IN benchmark tests, we made the following changes to Rhino’s default configuration.
Rhino’s memory sizes were adjusted as follows to gracefully handle the load required by this benchmark:
| Parameter | Value |
|---|---|
-Xmx |
8192M |
-Xms |
8192M |
-XX:MaxNewSize |
1536M |
-XX:NewSize |
1536M |
Rhino’s default configuration was adjusted as follows:
| Parameter | Value | Rationale |
|---|---|---|
Staging queue size |
42000 |
Accommodate 1 second’s worth of events in the queue without loss, as a reasonable protection against sudden traffic spikes combining badly with garbage collection pauses. |
Local Memory DB size |
600M |
Allow some contingency space in MemDB, just in case. Normal usage is stays below 340M, and the default is 400M. |
CGIN’s default configuration was adjusted as follows:
| Parameter | Value | Rationale |
|---|---|---|
|
850000 |
Increase the maximum number of open dialogs from the default 100,000. This benchmark requires at least 300,000. |
|
850000 |
Increase the number of invoke and activity timers, without depending on the autosizing option. |
Results
Please review the IN benchmark results here.
IN benchmark results
Test procedure
-
Calls were evenly distributed between all available cluster nodes.
-
All calls had a duration of 60s.
-
MAP queries were required for 10% of calls.
-
Benchmarks were taken over a two-hour test run, with an additional 15 minutes for JIT compilation.
Summary
| Cluster size | Calls / sec | TCAP messages / sec | Events / sec | Results |
|---|---|---|---|---|
|
One node |
5,000 |
31,000 |
42,000 |
|
|
Two nodes |
10,000 |
62,000 |
84,000 |
SLEE events per second dramatically exceed the TCAP message count in the table above because each inbound TCAP message generates:
-
one event for itself;
-
a dialog state change event, if appropriate (e.g. the first TC-Continue received after sending a TC-Begin indicates dialog acceptance); and
-
one event for each TCAP component the TCAP message contains (e.g. an operation or a response).
Outbound messages do not trigger events.
Types of graphs
The individual test results include the following types of graphs:
Response times |
Distribution of response-time changes during the course of the test run. |
|---|---|
Response time distribution |
Overall distribution of response times from the entire test run. |
CPU utilization |
Percentage of CPU used by Rhino nodes, as measured by |
Heap |
Heap usage. |
IN 2 node results
SIP benchmarks
Below is an overview of how we test Rhino performance with SIP, followed by links to the benchmarks.
About the SIP test scenario
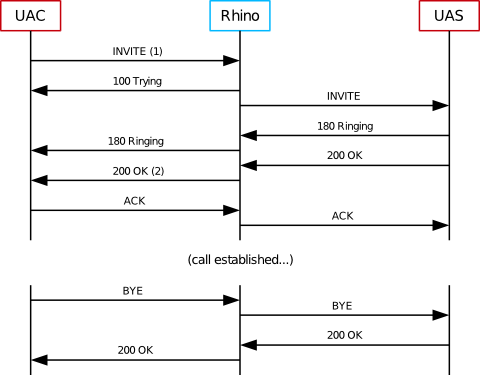
To test the SIP performance of Rhino, we used a "Back-to-Back User Agent", or B2BUA, a common building block in SIP services. The test B2BUA is a simple routing B2BUA, that forwards SIP messages between two SIP dialogs, implemented as a SLEE service using the Metaswitch SIP resource adaptor.
Metaswitch chose the B2BUA service as a SIP benchmark because it is fundamental to many SIP applications. The B2BUA sits between the caller and the callee, maintaining SIP dialog state for each party, for the duration of the session. Many applications can be implemented by adding features on top of a generic B2BUA component (such as the test example) — so the performance of this B2BUA is a true indicator of how real-world B2BUA-based applications should perform.
| |
The Rhino SDK distribution includes SIP examples of a B2BUA service and SIP RA. |
SIP benchmark environment and configuration
Below are the hardware, software, and Rhino configuration used for the Rhino benchmarks.
Hardware
The SIP High Availablity (HA) benchmark tests were run using configurations ranging from one node to four node clusters.
Each Rhino node is run on its own host. Simulators are each run on their own hosts, with horizontal scaleout to properly load the Rhino nodes.
All machines used for benchmarking are provided by Amazon’s EC2 public cloud. We use exclusively c5.2xlarge instances as described here. The c5.2xlarge instance type has 8 vCPU (hardware threads) and 16 GiB of ram, with up to 10 Gbps networking. Of particular note here, there are two generations of Intel hardware which may be used for any instance, entirely at Amazon’s discretion.
Software
The SIP benchmark tests used the following software.
| Software | Version |
|---|---|
|
Java |
Oracle Corporation OpenJDK 64-Bit Server VM 11.0.7+10-LTS |
|
Rhino |
Rhino 3.0.0.3 |
|
3.0.0.0 |
Rhino configuration
For the SIP benchmark tests, we made the following changes to the Rhino 3.0.0 default configuration.
Rhino’s memory sizes were adjusted as follows to gracefully handle the load required by this benchmark:
| Parameter | Value |
|---|---|
-Xmx |
8192M |
-Xms |
8192M |
-XX:MaxNewSize |
1536M |
-XX:NewSize |
1536M |
Staging queue size was adjusted to accommodate more than 2 seconds worth of events in the queue without loss, as a reasonable protection against sudden traffic spikes combining badly with garbage collection pauses.
| Parameter | Value |
|---|---|
Staging queue size |
25000 |
SIP configuration
The High Availability (HA) benchmarks are configured with replication disabled. We use TCP transport throughout to avoid retransmissions which can occur with UDP.
Benchmark results
Please review the SIP benchmark results here.
SIP benchmark results
Below is a summary of the Java 11 results.
Test procedure
-
All tests used TCP as the SIP transport.
-
Calls were evenly distributed between all available cluster nodes.
-
All calls had a duration of 60s.
-
Benchmarks were taken over a two-hour test run, with an additional 15 minutes for JIT compilation.
Summary
| Cluster size | Call Rate | Event Rate | SIP message Rate | Results |
|---|---|---|---|---|
|
One node |
2000 |
12,000 events/s |
26,000 messages/s |
|
|
Two nodes |
4000 |
24,000 events/s |
52,000 messages/s |
|
|
Three nodes |
6000 |
36,000 events/s |
78,000 messages/s |
|
|
Four nodes |
8000 |
48,000 events/s |
104,000 messages/s |
Types of graphs
The individual test results include four types of graphs:
Response times |
Distribution of response-time changes during the course of the test run. |
|---|---|
Response time distribution |
Overall distribution of response times from the entire test run. |
CPU utilization |
Percentage of CPU used on Rhino servers, as measured by |
Heap |
Heap usage. |