With each major release of the Rhino TAS, OpenCloud provides a standard set of benchmark data.
We measure platform performance in realistic telecommunications scenarios so the results are genuine and reliable.
The Benchmarks
| |
PROPRIETARY AND CONFIDENTIAL
Rhino benchmark information on these pages is proprietary and confidential. Do not reproduce or present in any fashion without express written consent from OpenCloud. |
Other documentation for the Rhino TAS can be found on the Rhino TAS product page.
IN Benchmarks
Below is an overview of how we test Rhino performance with IN, followed by links to the benchmarks.
About the IN test scenario
To test the IN performance of Rhino {space-metadata-from:rhino-internal-version}, we use a Virtual Private Network (VPN) application, which:
-
provides number-translation and call-barring services for groups of subscribers
-
uses CAPv3 and INAP CS1 protocols for call-control, and MAPv3 for location information
-
uses OpenCloud’s CGIN APIs and resource adaptor to provide CAP and MAP support.
OpenCloud developed this VPN application to meet genuine business requirements from a Tier-1 network operator, giving us genuine benchmarks — instead of, for example, using a trivial demo application.
This test application performs functions that are common to many real-world IN applications:
-
monitoring the entire call, and reliably maintaining state for the duration of the call
-
interacting with external systems (MSC, HLR, call detail records)
-
supporting a large subscriber database.
The VPN Application
The VPN application provides number-translation and call-barring services for groups of subscribers. It uses CAPv3 for call-control and MAPv3 for location information.
| If the A party… | then VPN responds with: |
|---|---|
|
…has called a B party in their own VPN using short code or public number |
|
|
…and B party are not in the same VPN |
|
|
…dials a short code that doesn’t exist |
|
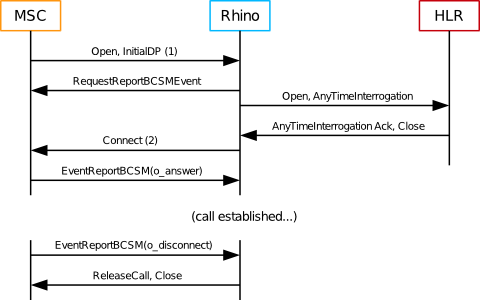
Call flow
The VPN application applies incoming call-screening and outgoing call-screening rules, some of which require location information and involve a MAP query of the HLR.
| |
Measuring call setup time
|
IN Benchmark Environment and Configuration
Below are the hardware, software, and Rhino configuration used for the IN benchmarks.
Hardware


Hardware specifications
| Machine | CPUs | Hardware threads | RAM | OS |
|---|---|---|---|---|
|
Rhino node 1 |
2 x 6-core Xeon X5650 2.67GHz |
24 |
24G |
RHEL 7 |
|
Rhino node 2 |
2 x 6-core Xeon X5650 2.67GHz |
24 |
24G |
RHEL 7 |
|
SGC cluster 1 |
2 x 6 core Xeon X5660 2.8GHz |
24 |
32G |
Centos 7 |
|
SGC cluster 2 |
2 x 6 core Xeon X5660 2.8GHz |
24 |
32G |
Centos 7 |
|
Simulator host 1 |
2 x 6 core Xeon X5660 2.8GHz |
24 |
36G |
RHEL 6 |
|
Simulator host 2 |
2 x 6 core Xeon X5660 2.8GHz |
24 |
36G |
RHEL 6 |
Software
The IN benchmark tests used the following software.
| Software | Version |
|---|---|
|
Java |
JDK 1.7.0_71 and JDK 1.8.0_60 |
|
Rhino |
Rhino 2.5.0.1 |
|
CGIN |
1.5.4.1 |
|
CGIN VPN |
1.5.4.1 |
|
CGIN Back End |
Rhino configuration
For the IN benchmark tests, we made the following changes to the Rhino 2.5 default configuration.
| Parameter | Value | Note |
|---|---|---|
|
TCAP stack |
OCSS7 |
|
|
JVM Architecture |
64bit |
Enables larger heaps |
|
Heap size |
8192M |
|
|
New Gen size |
256M |
Increased from default of 128M to achieve higher throughput without increasing latency |
|
Staging queue size |
5000 |
Increased from default of 3000 to allow burst traffic |
|
Staging threads |
150 |
Increased from default of 30 for reduced latency at high throughput |
|
CGIN RA tcap-fibers.max-pool-size |
10 |
Increased from default of 4 for reduced latency at high throughput |
|
CGIN RA tcap-fibers.queue-size |
5000 |
Increased from default of 250 to allow load spikes without processing falling back to incoming thread |
|
CGIN RA ocss7.trdpCapacity |
850000 |
Increased from default of 100000 as required to allow sufficient inflight calls |
|
CGIN RA ocss7.schNodeListSize |
850000 |
Set from default autosize to match ocss7.trdpCapacity |
|
Local Memory DB size |
200M |
Increased from default of 100M to allow more in-flight calls |
Results
Please review the IN benchmark results.
IN Benchmark Results
Summary
| Cluster size | Call Rate | Event Rate | TCAP message Rate | Results |
|---|---|---|---|---|
|
One node |
8,000 |
36,000 events/s |
64,000 messages/s |
|
|
Two nodes |
15,000 |
67,500 events/s |
120,000 messages/s |
Notes
Below are notes about the test procedure, types of graphs in the results, and how to calculate the number of dialogs per second.
Test procedure
Test calls:
-
were evenly distributed between all available cluster nodes
-
had originating and terminating treatment
-
were monitored for the entire duration on the originating leg
-
lasted 60s.
10% of calls involved a map query.
Types of graphs
The individual test results include the following types of graphs:
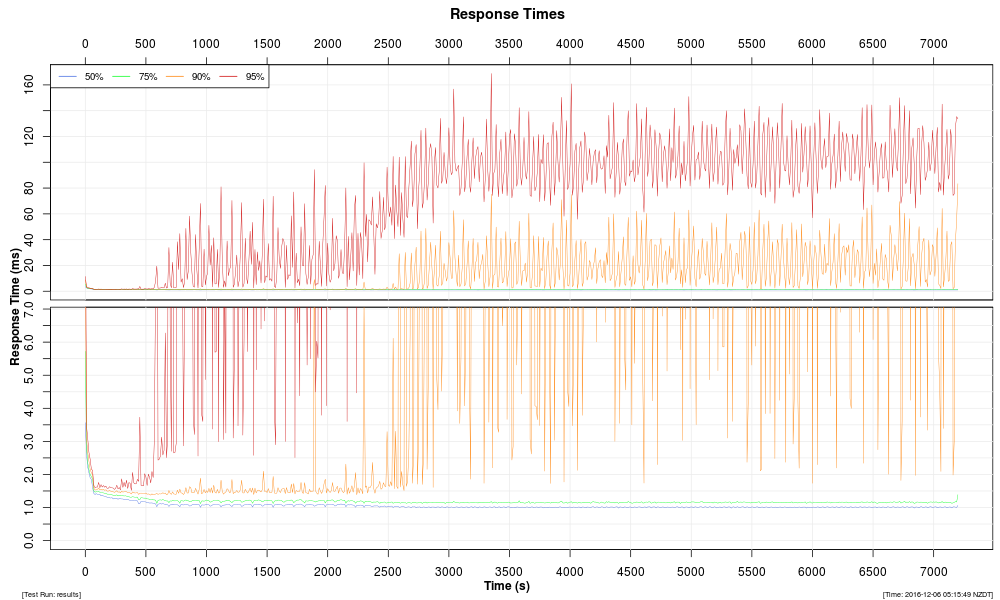
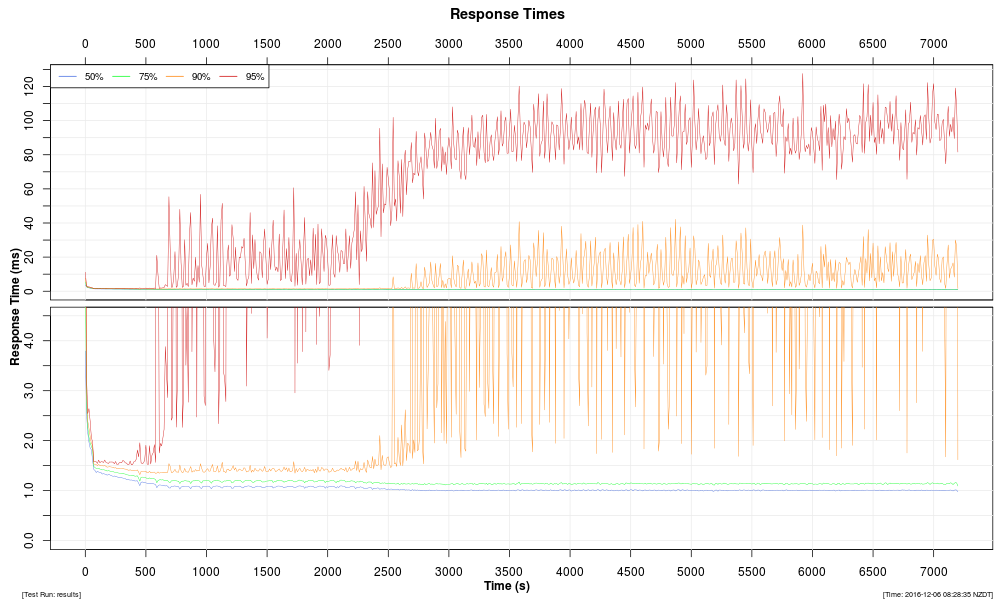
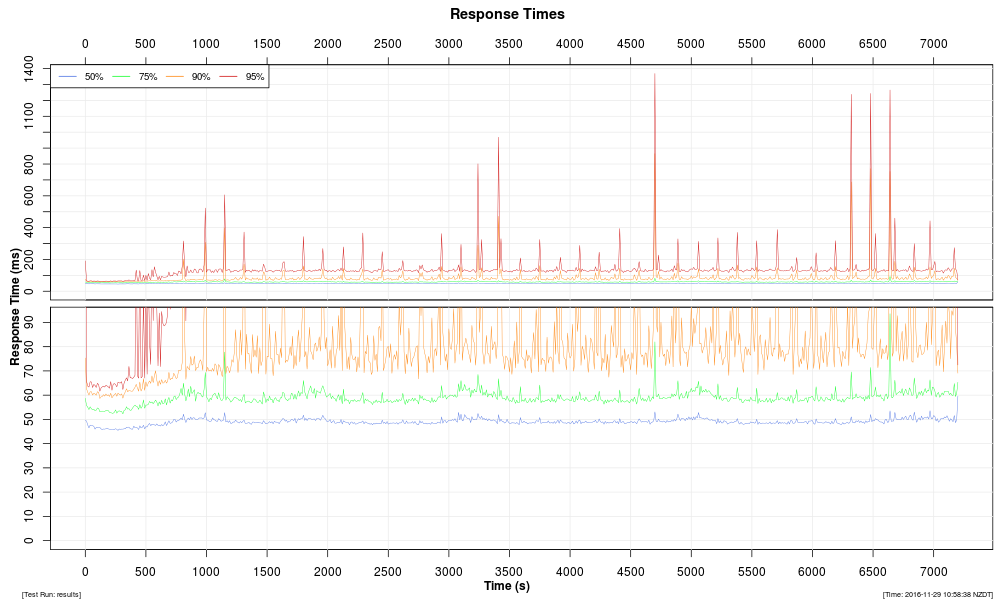
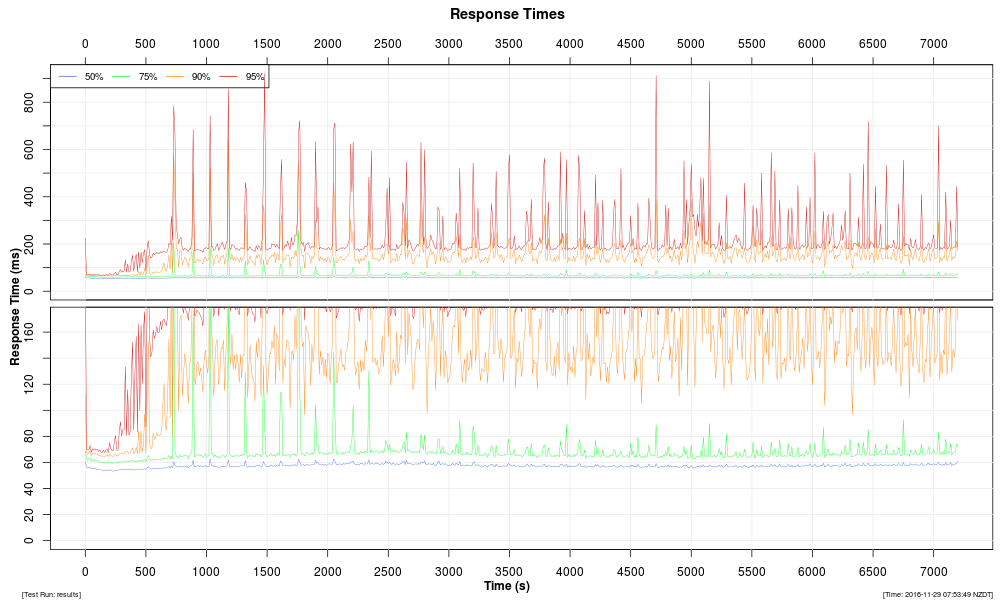
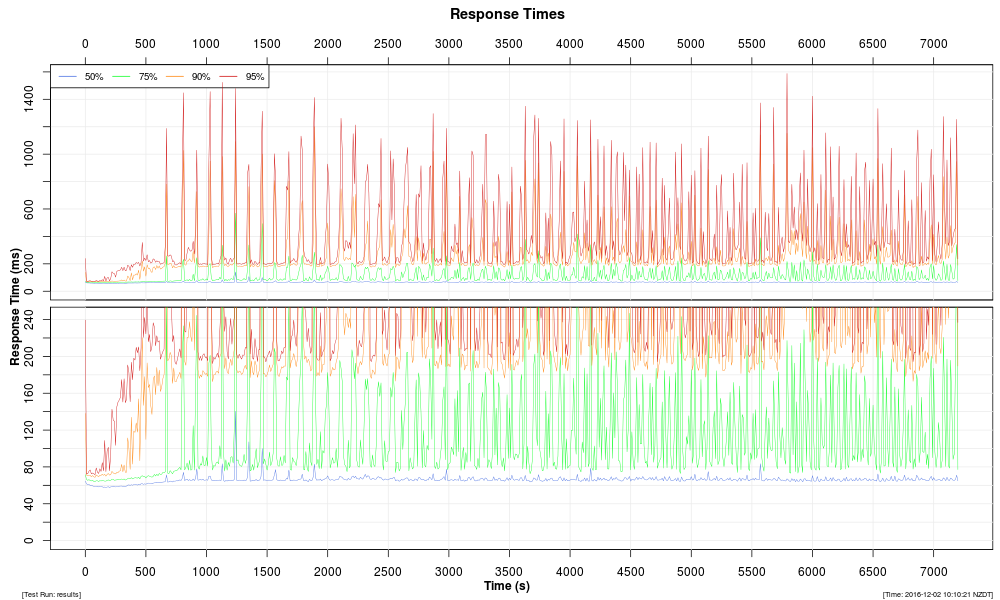
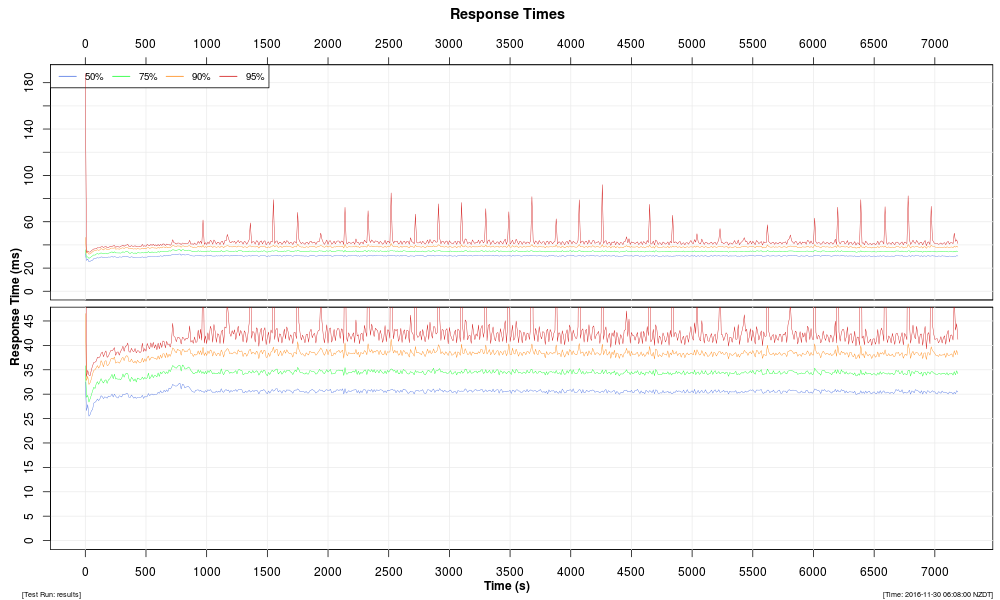
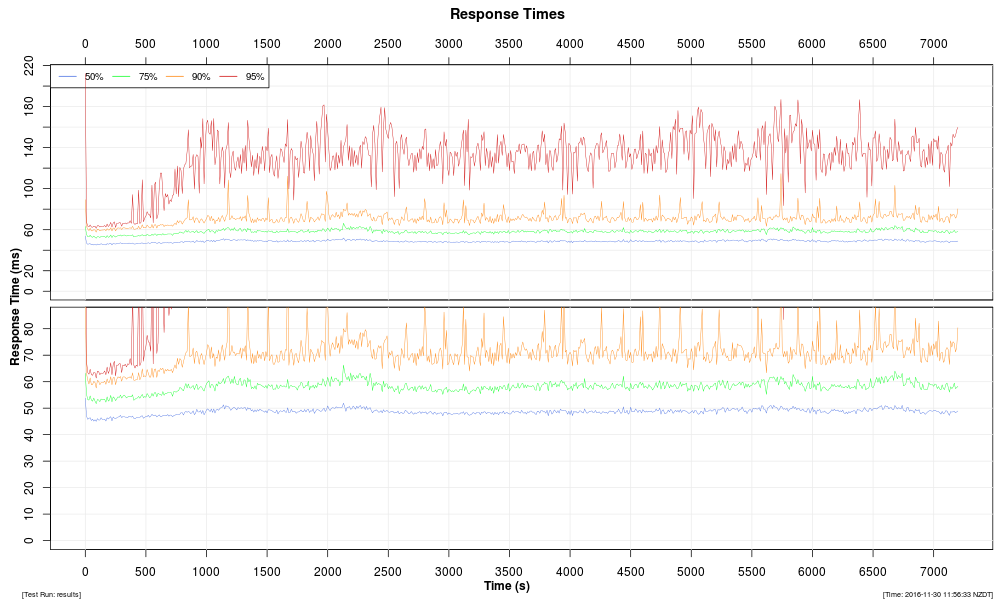
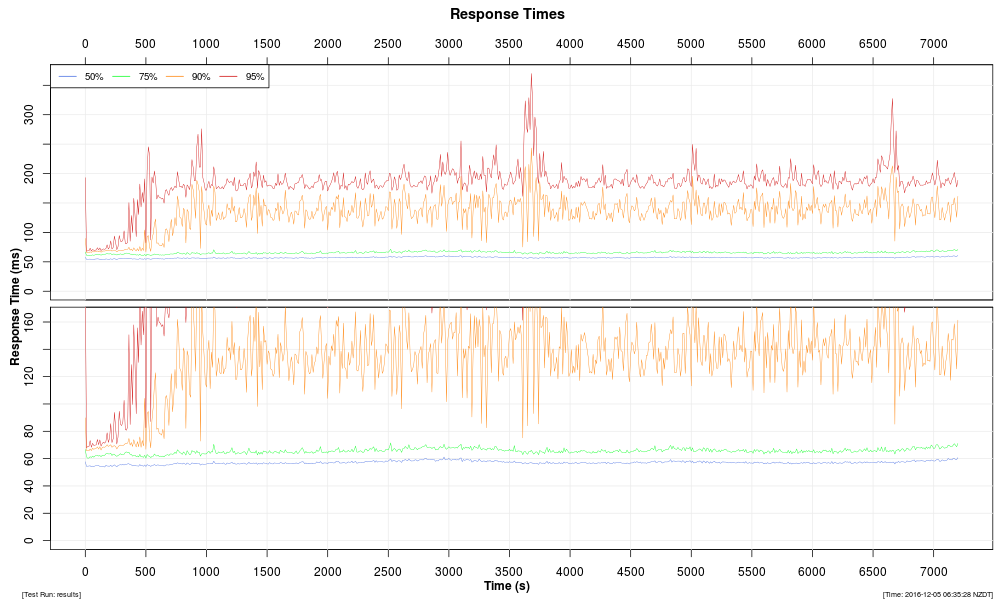
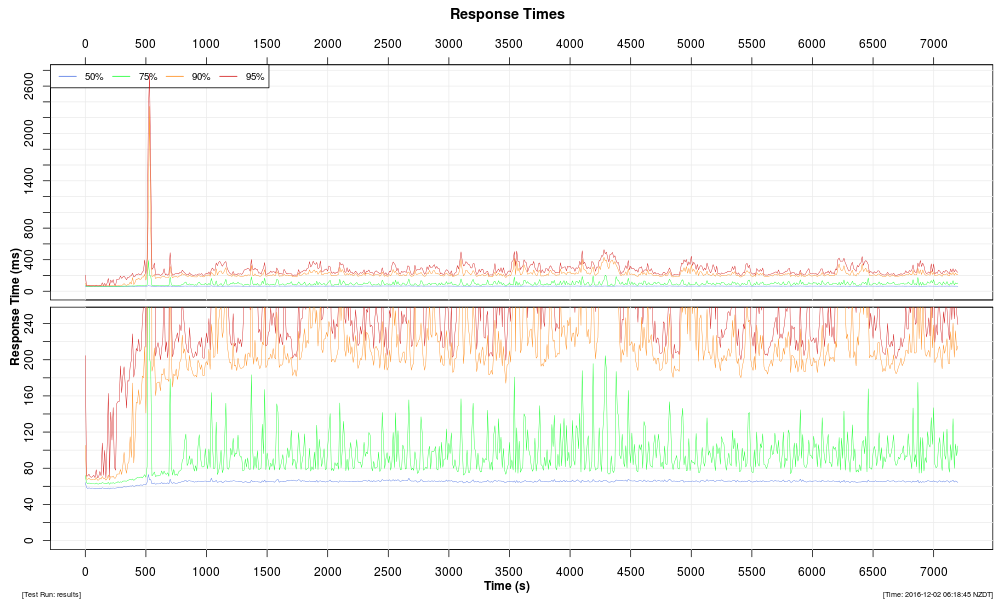
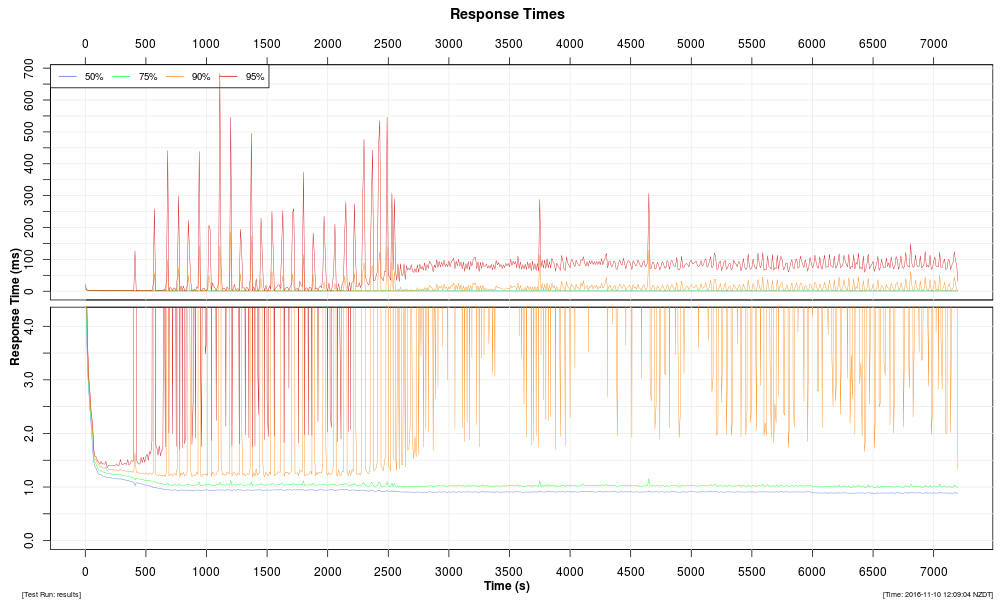
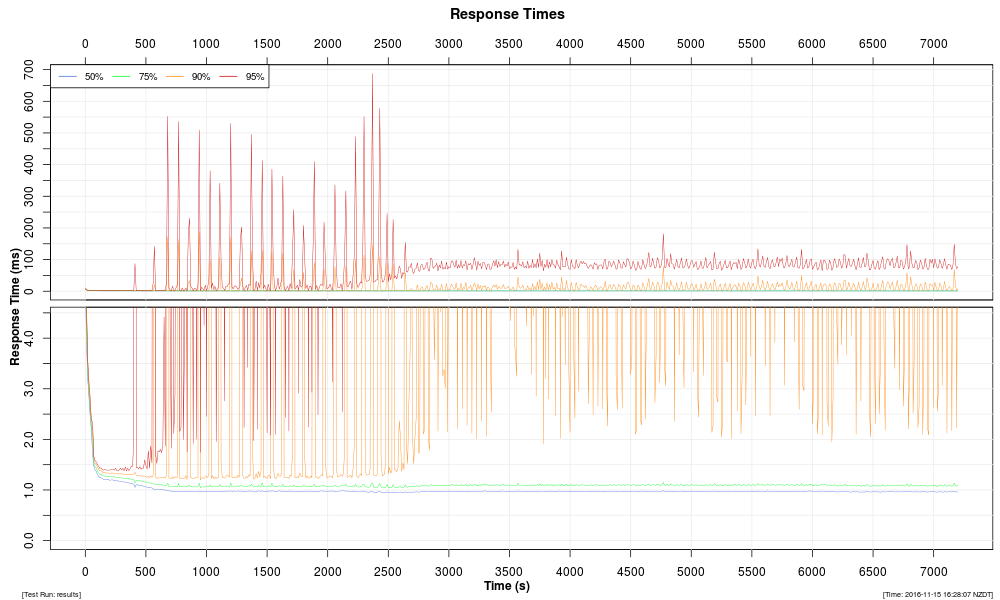
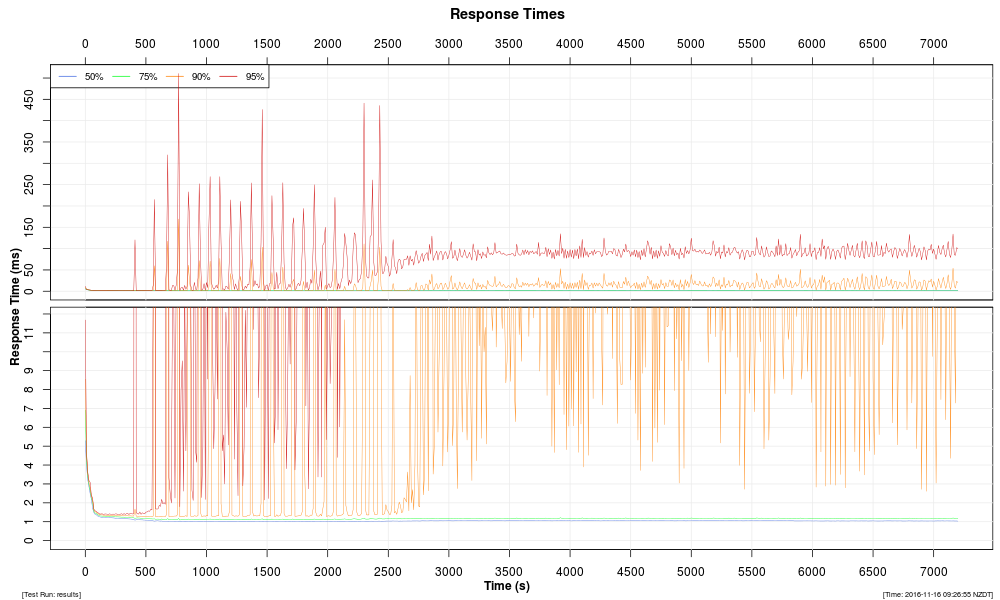
Response Times |
Distribution of response-time changes during the course of the test run. |
|---|---|
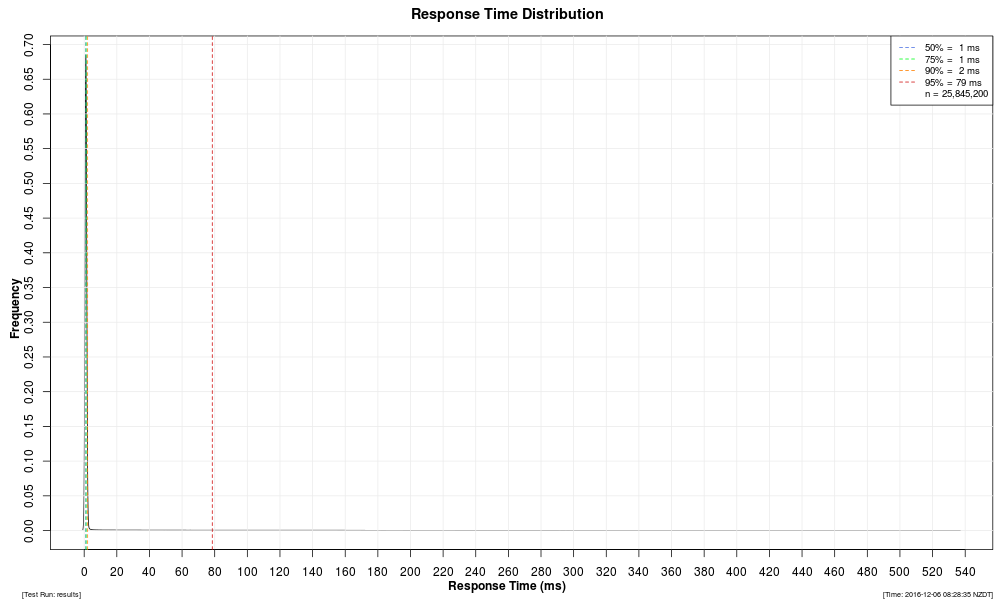
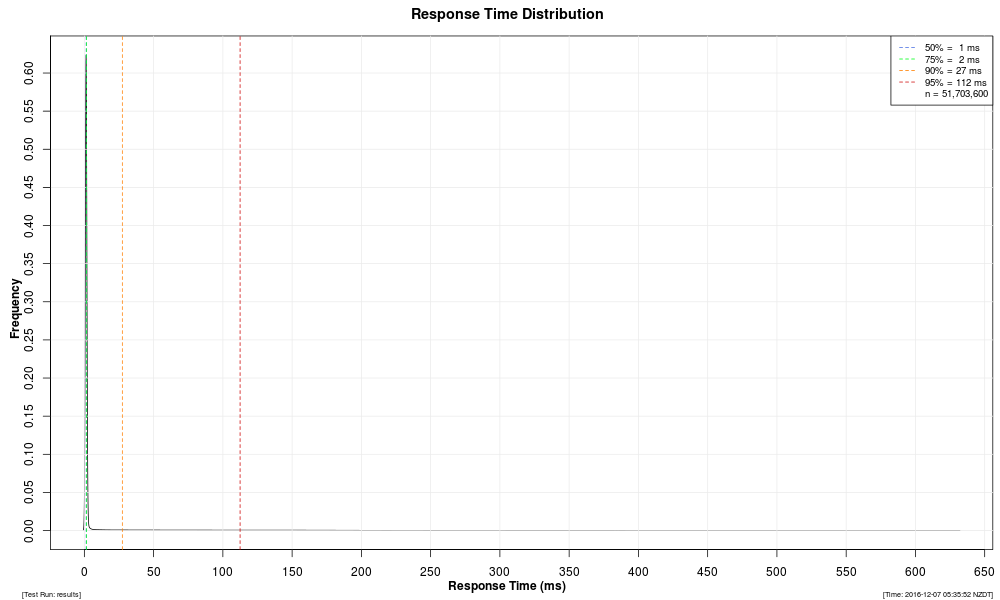
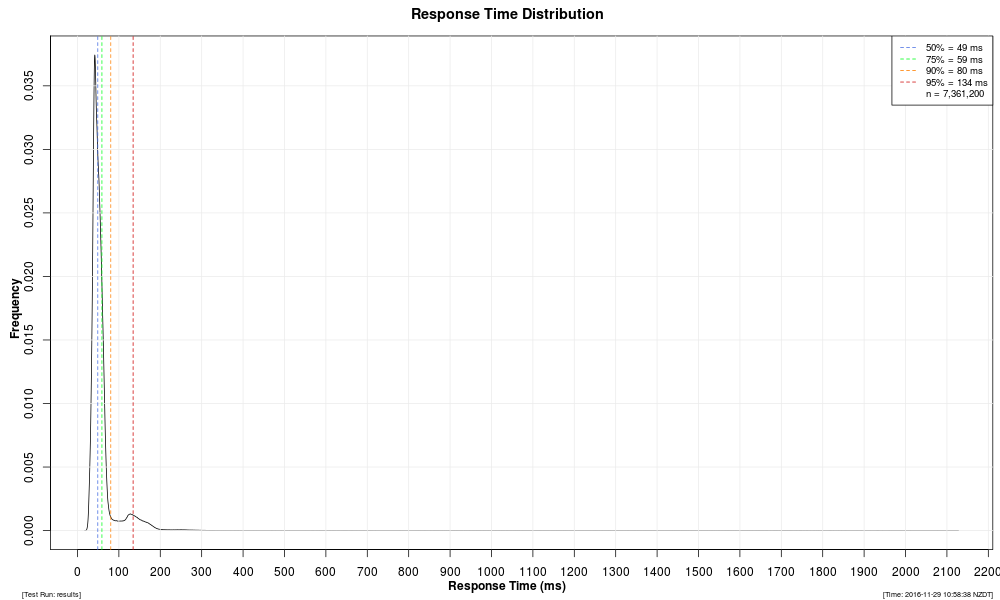
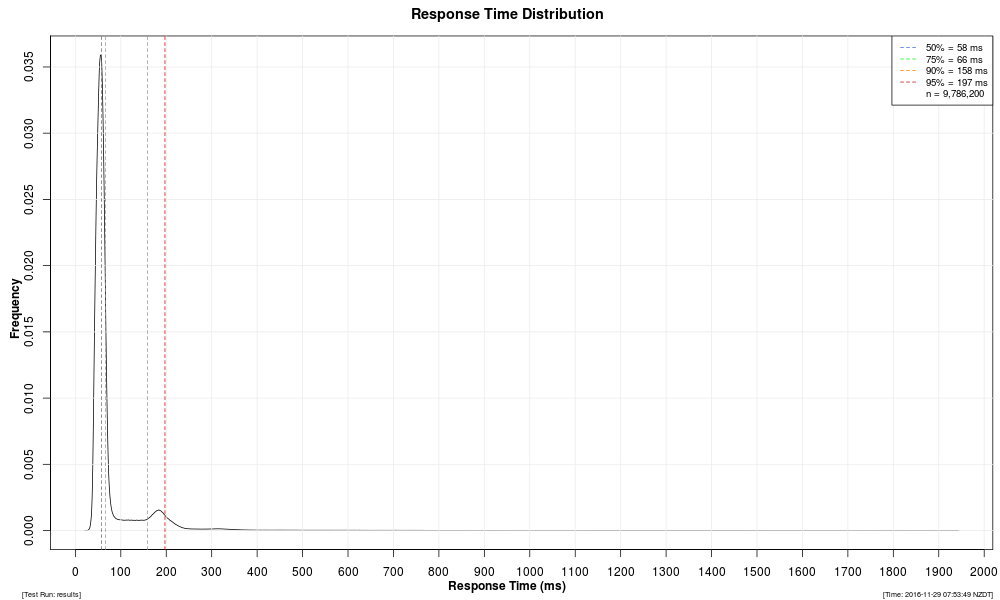
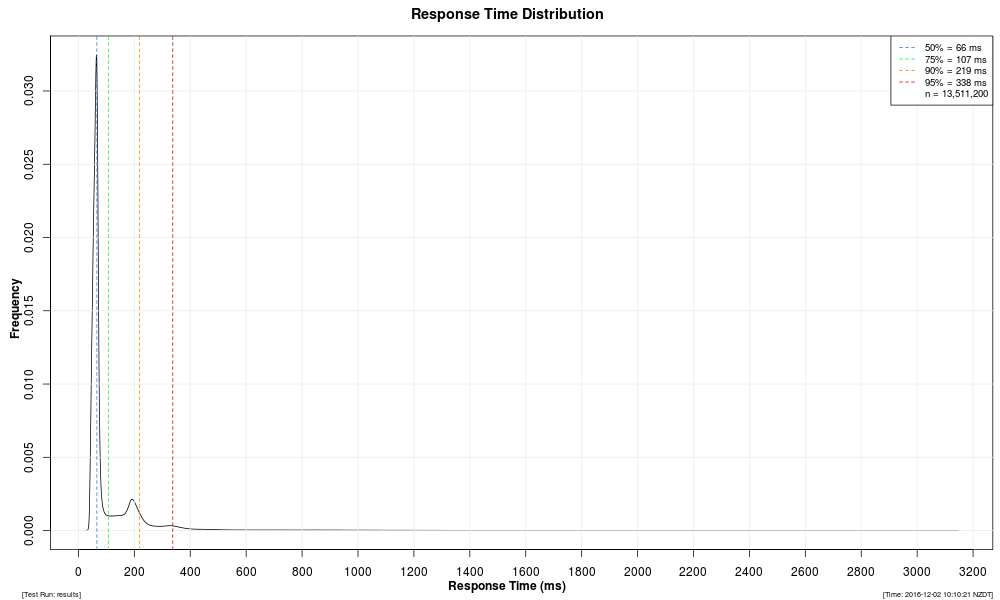
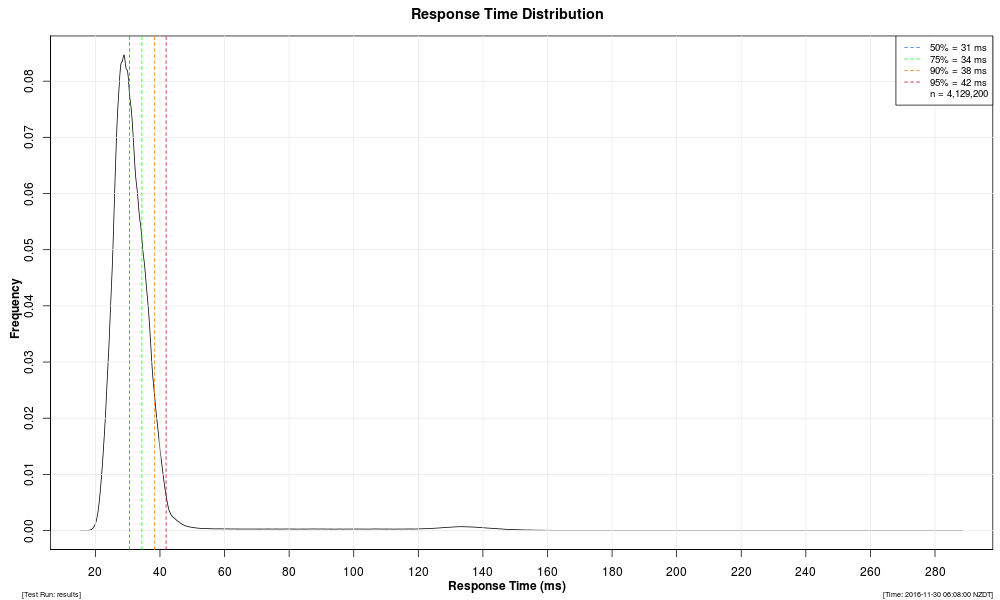
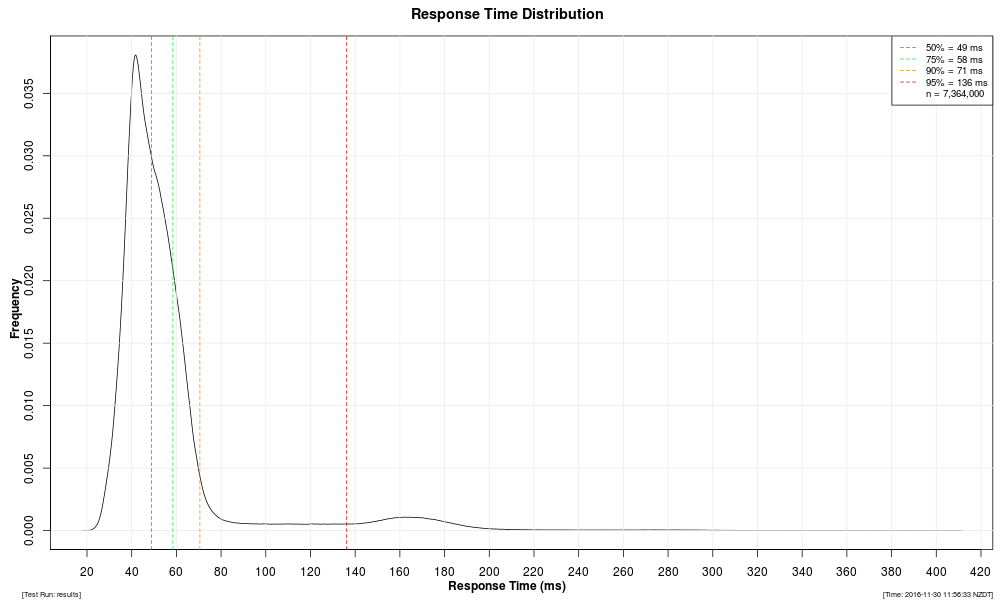
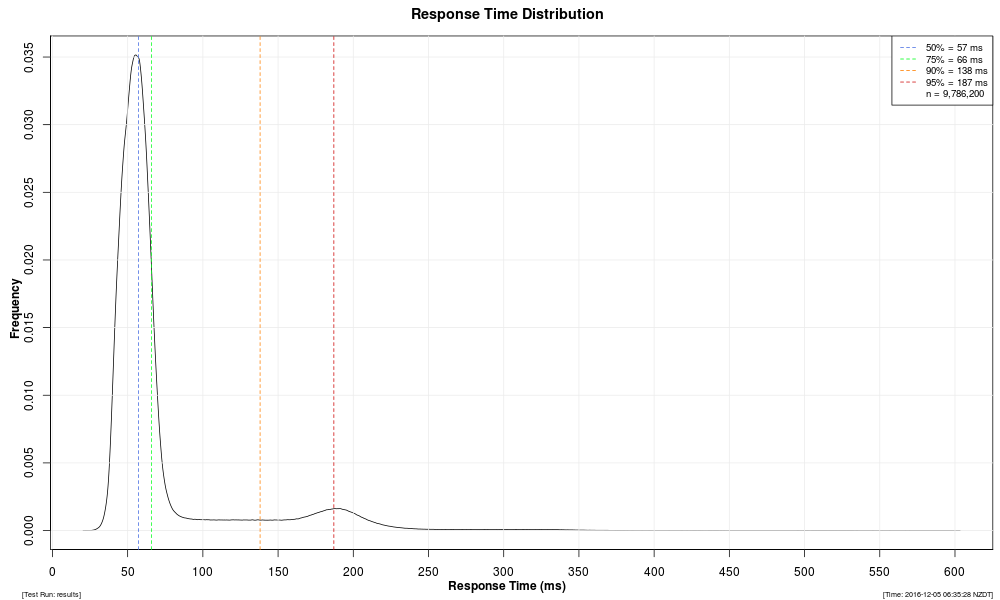
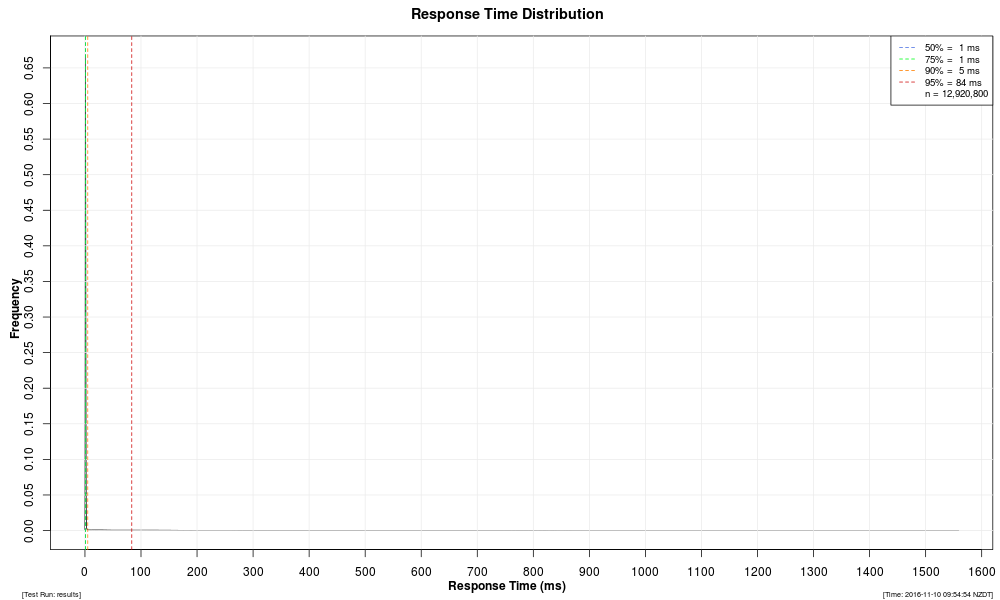
Response Time Distribution |
Overall distribution of response times from the entire test run. |
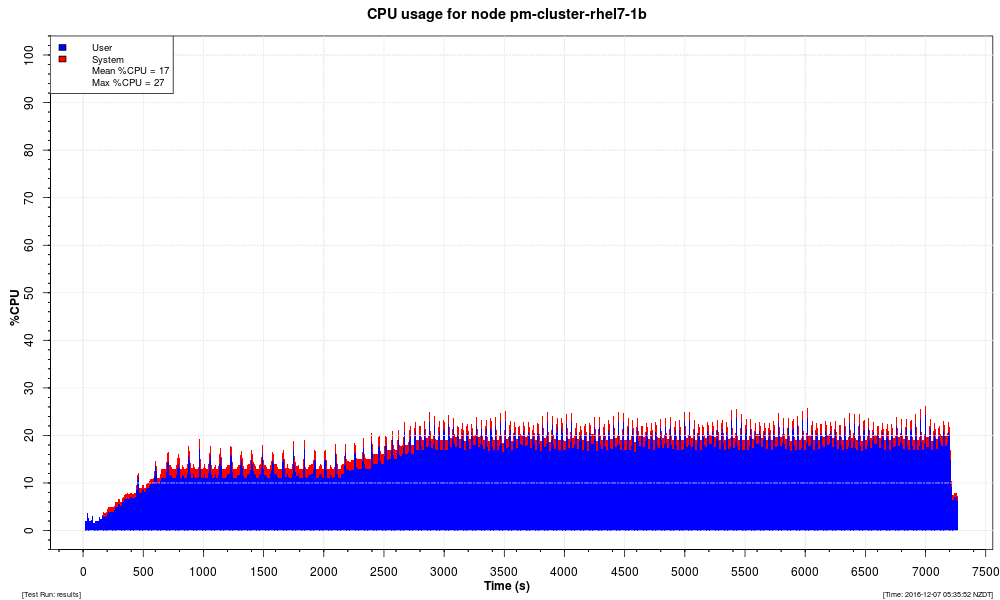
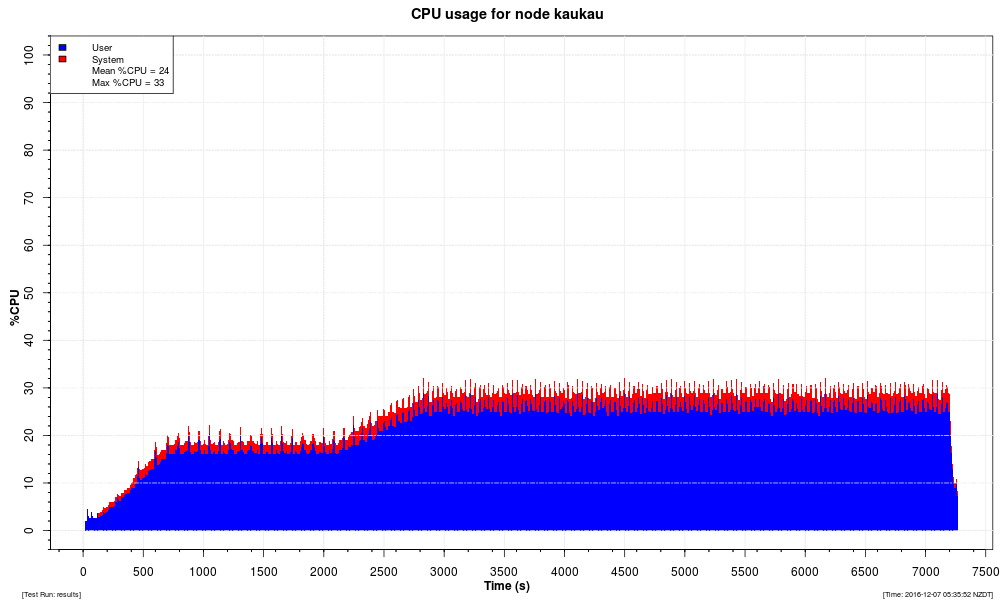
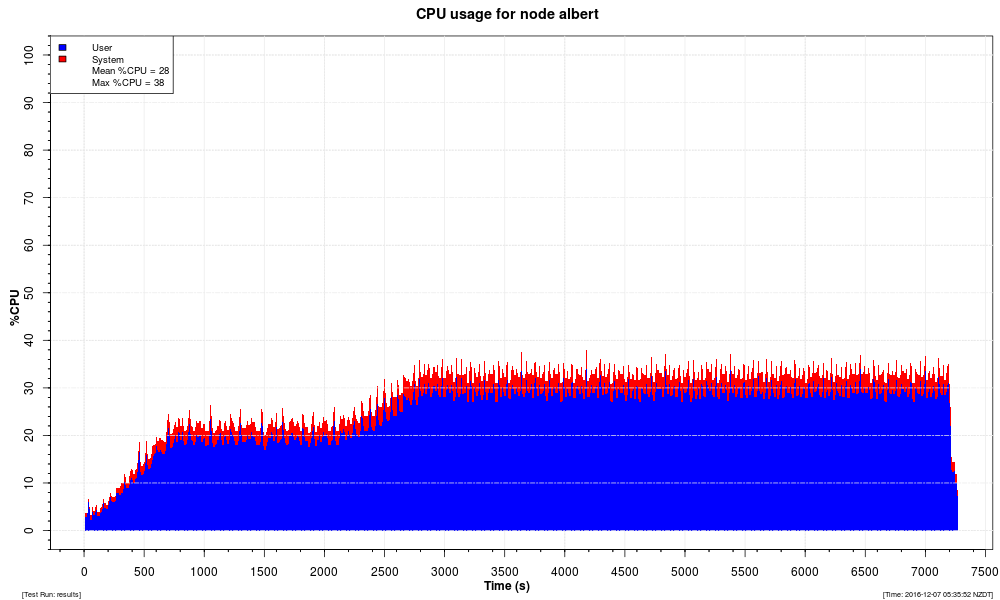
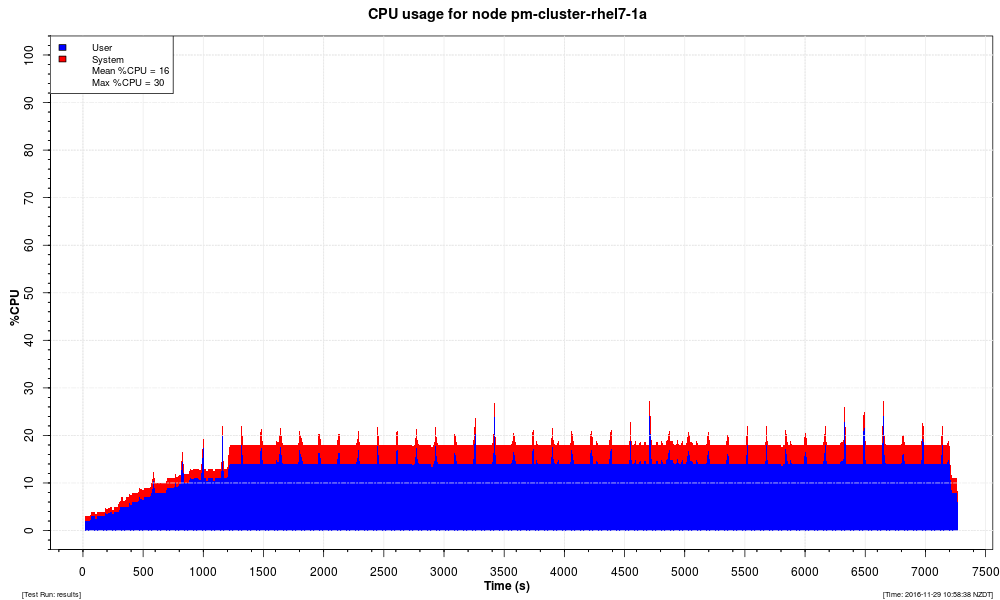
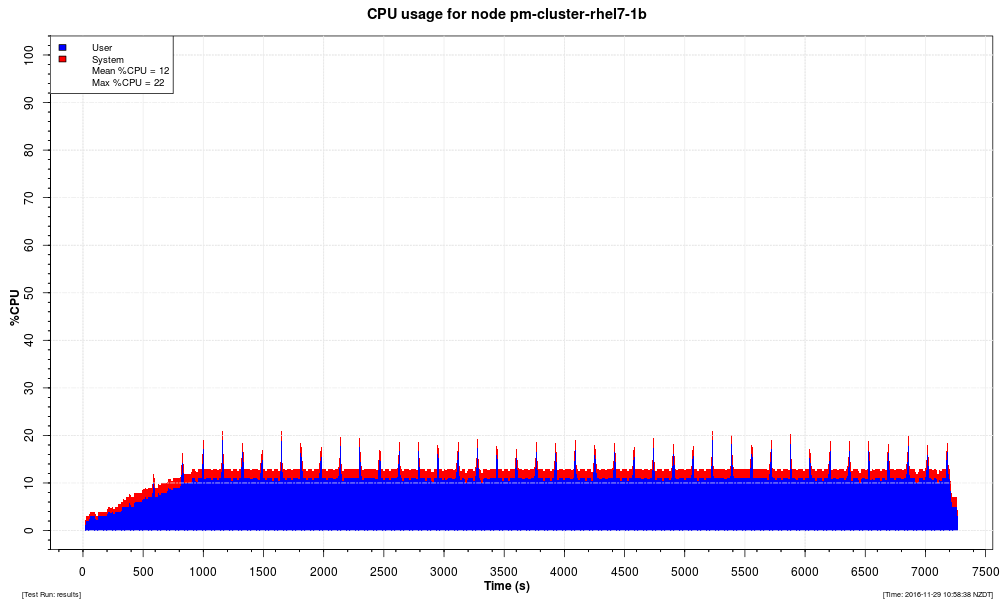
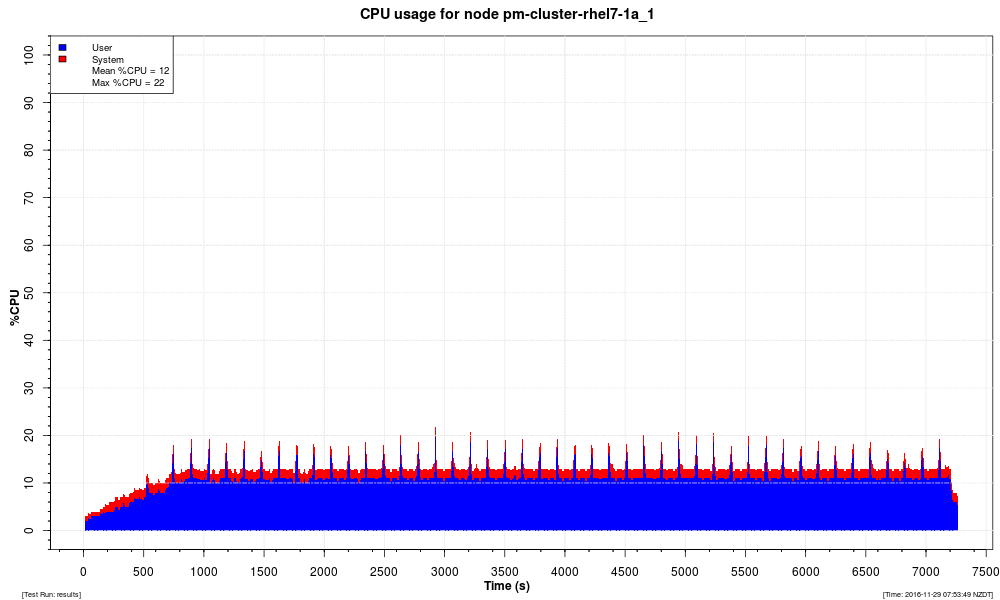
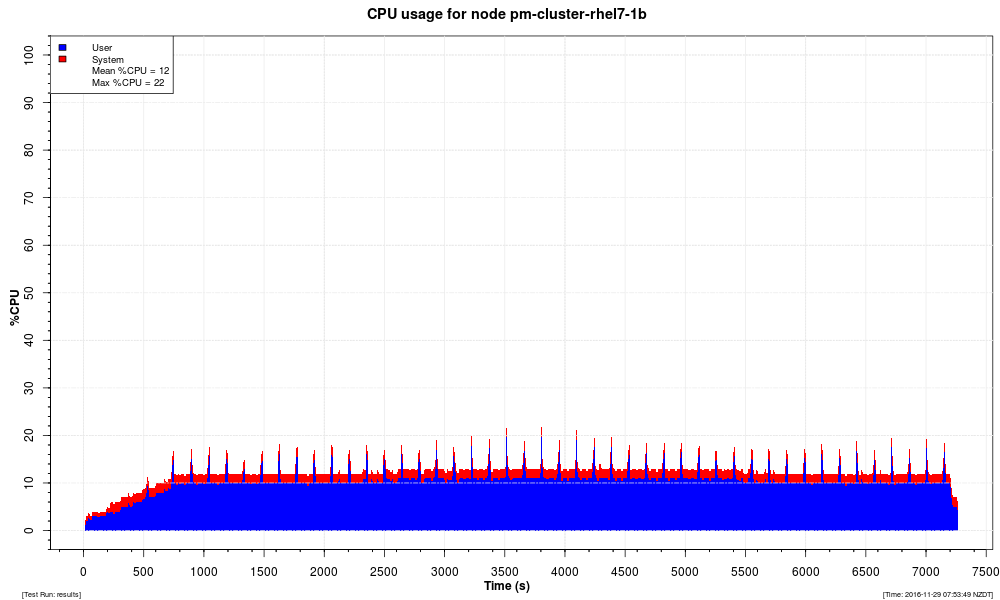
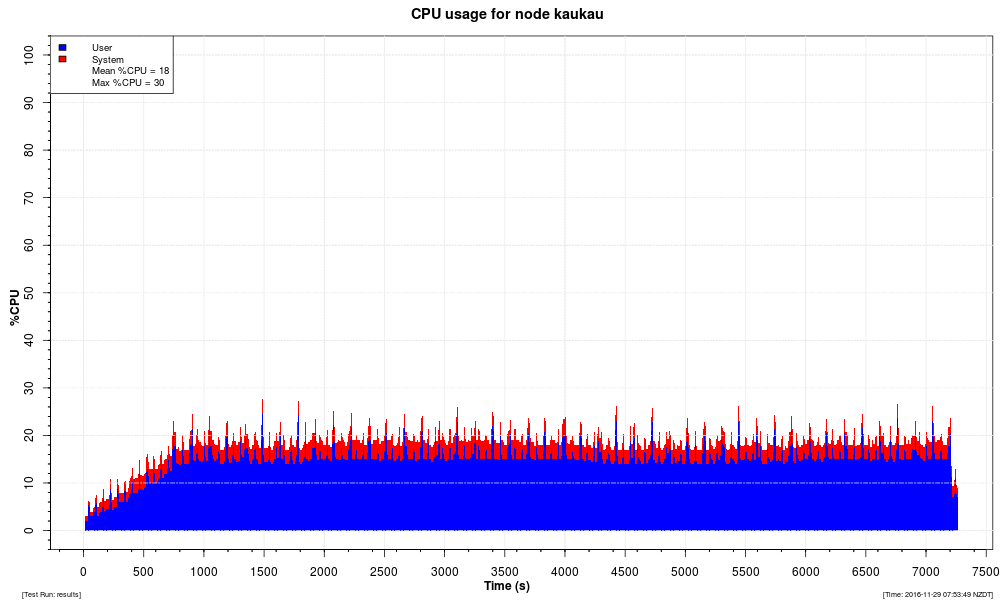
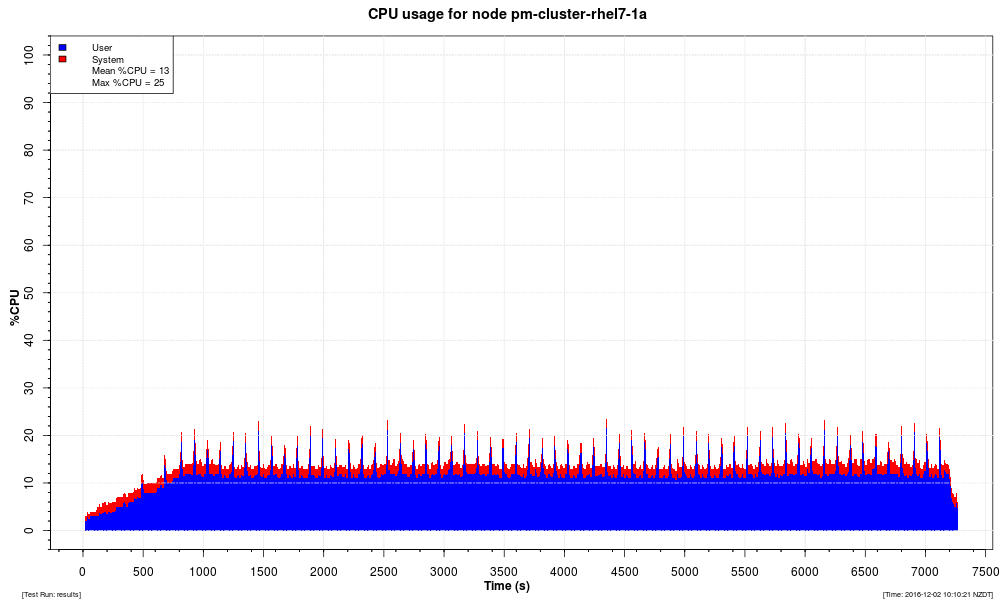
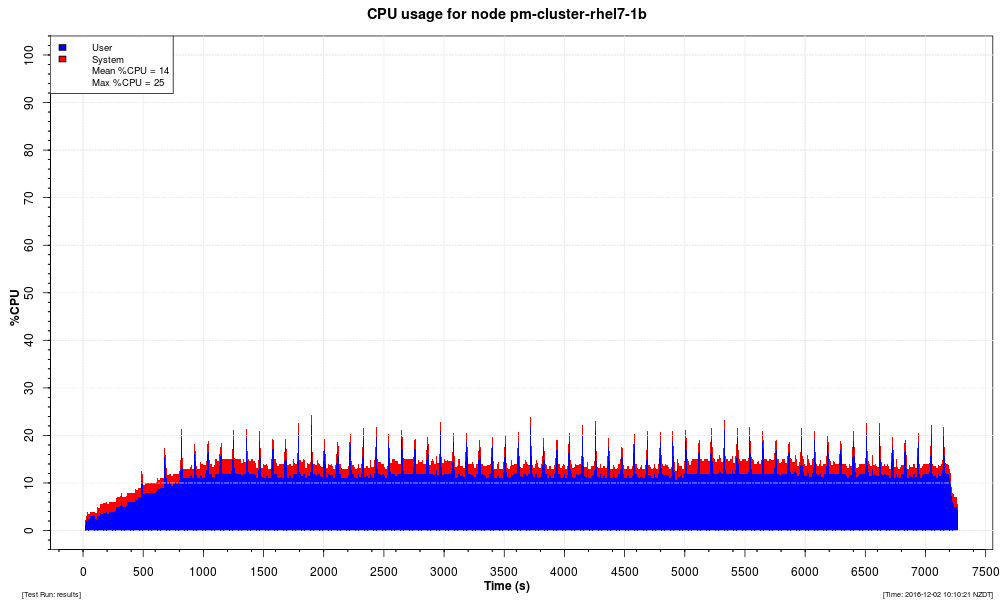
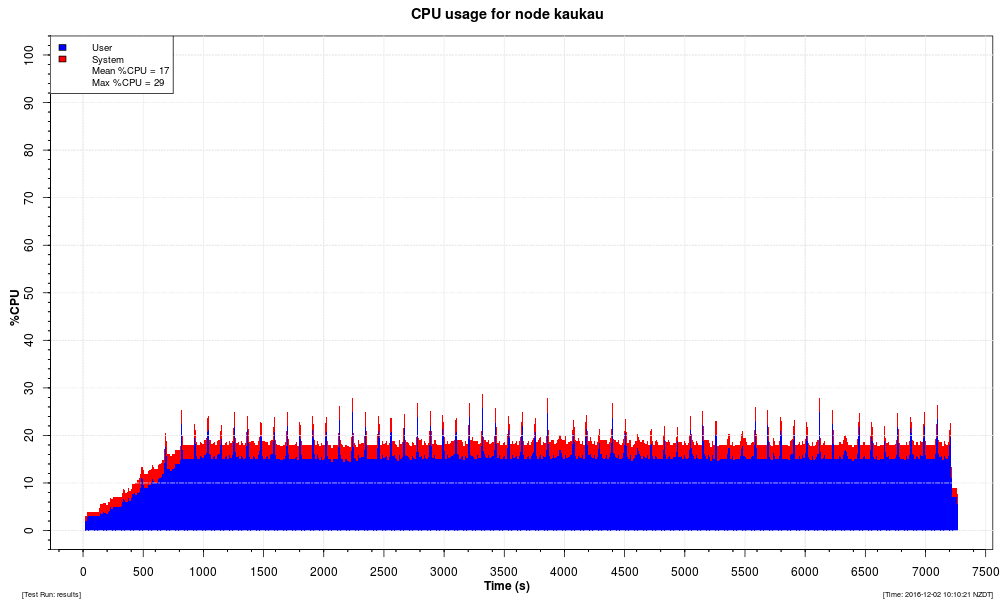
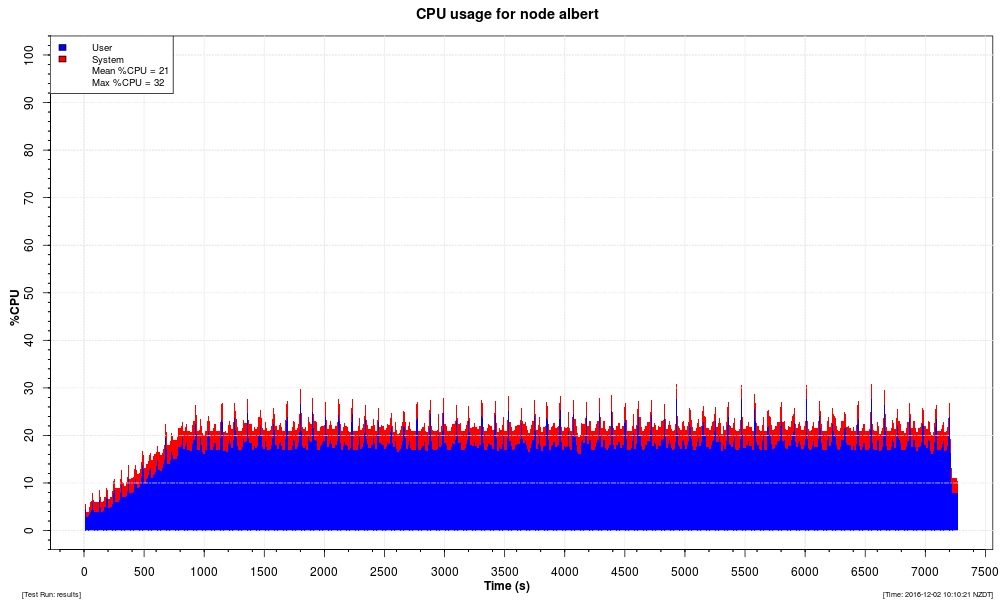
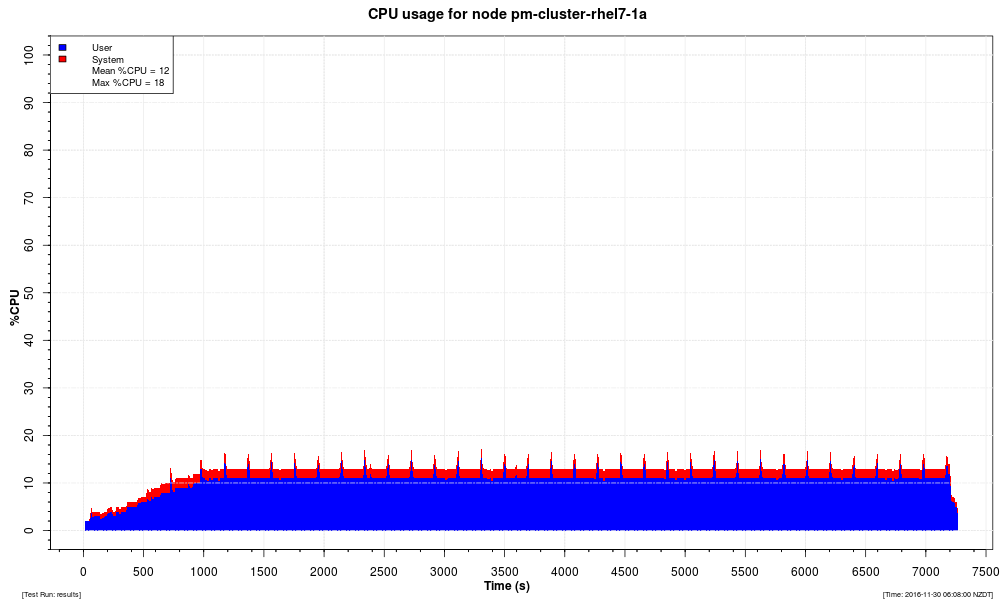
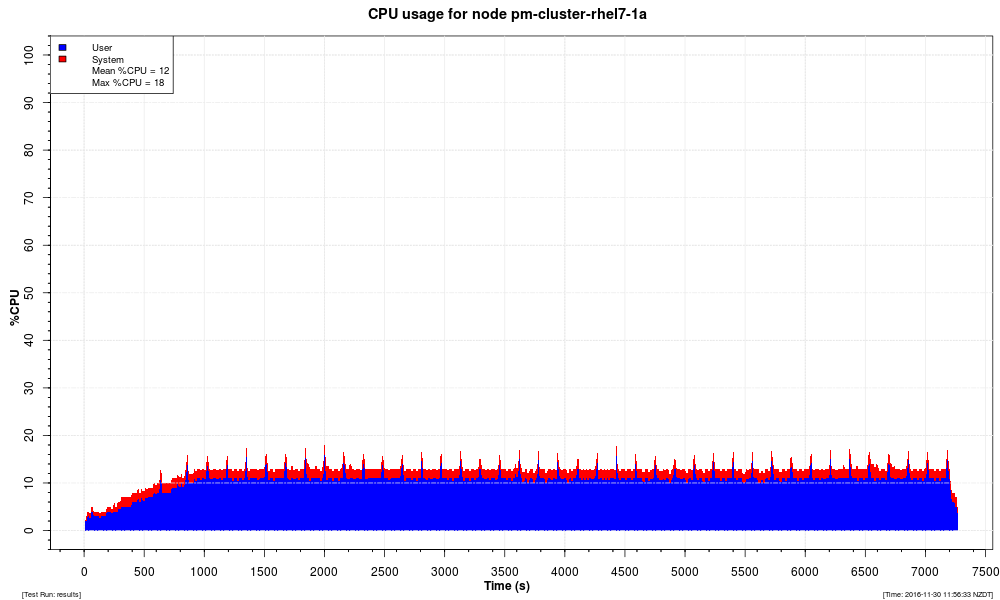
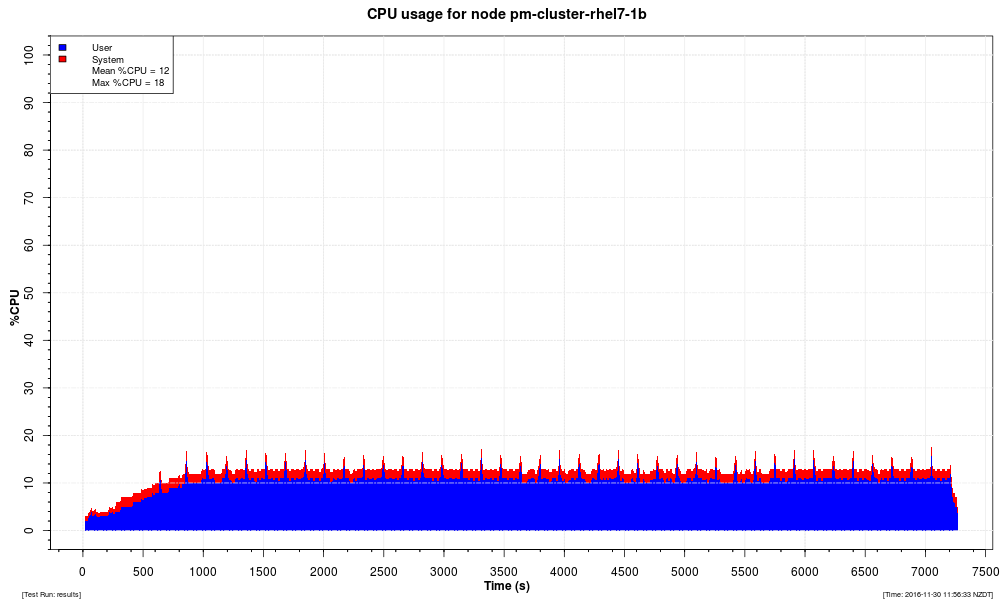
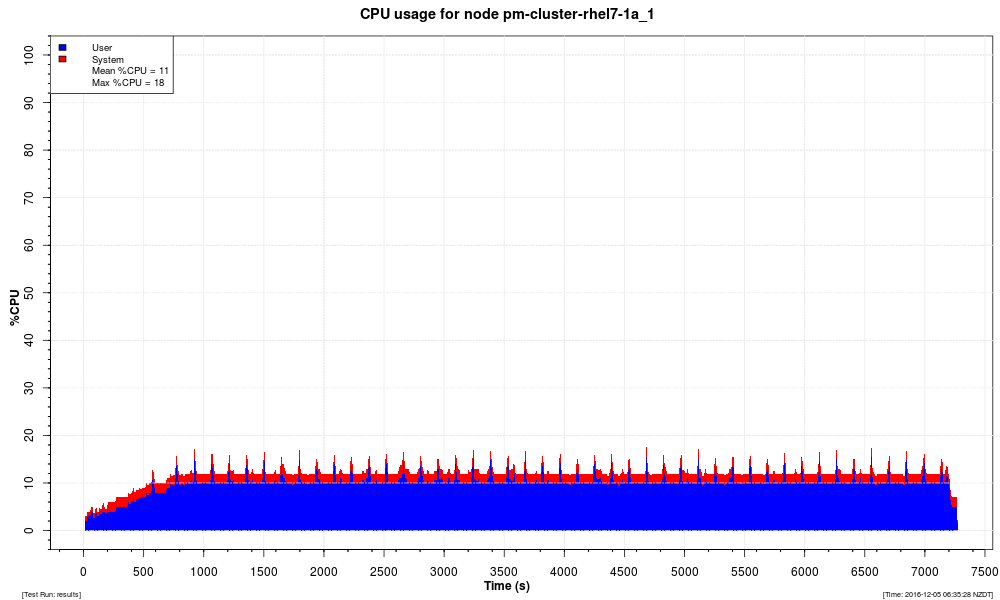
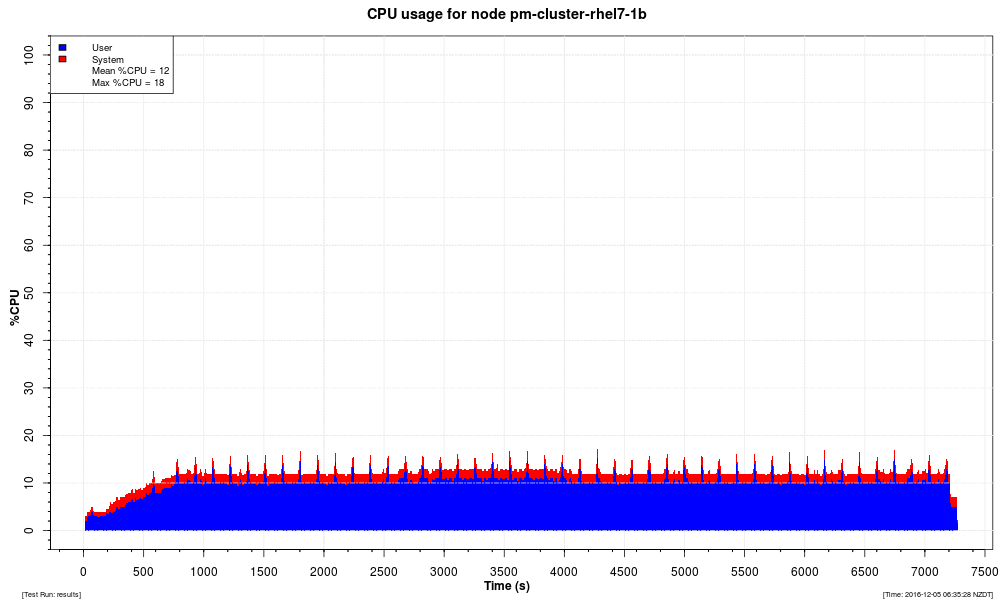
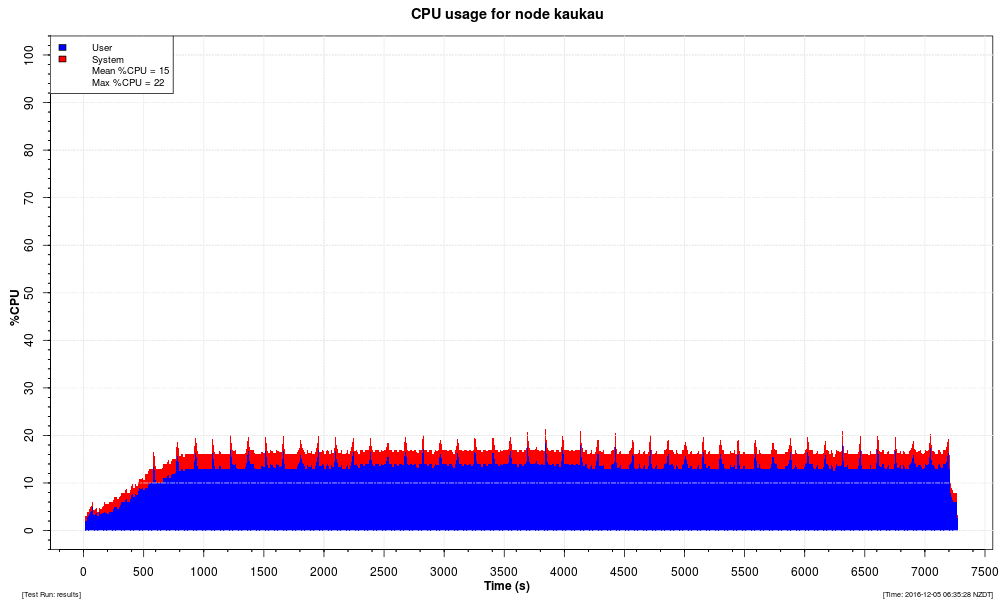
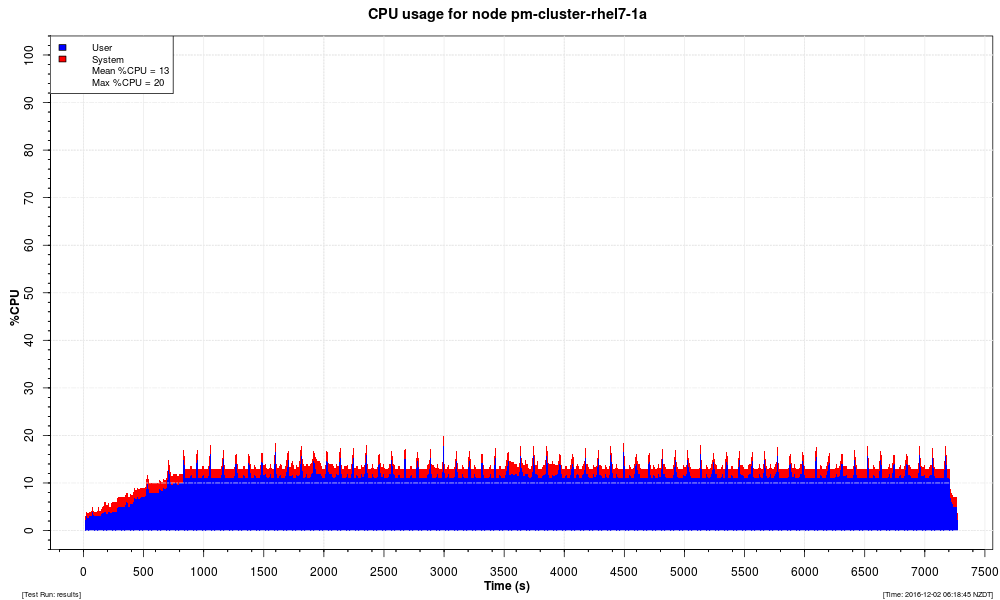
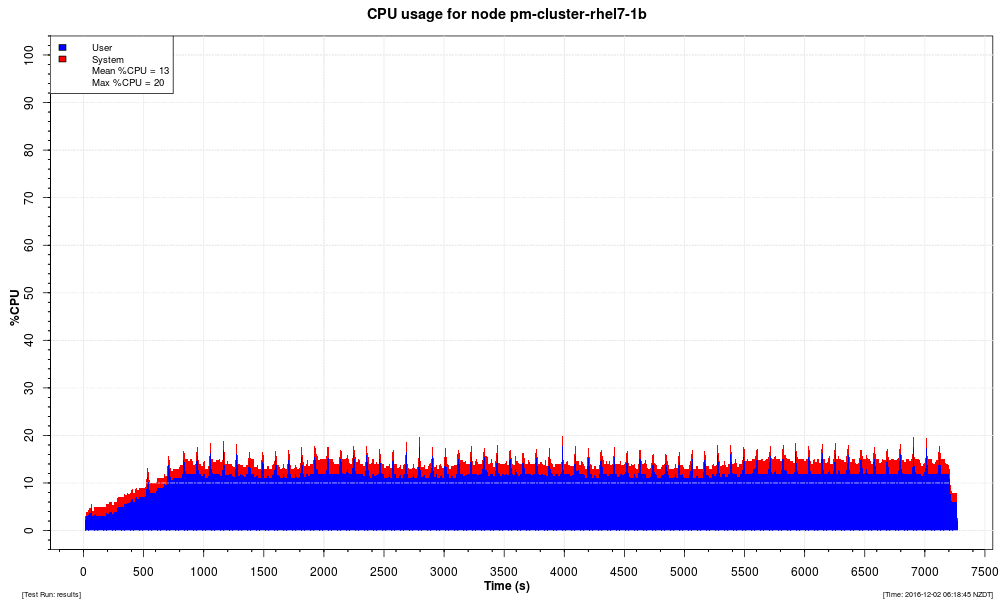
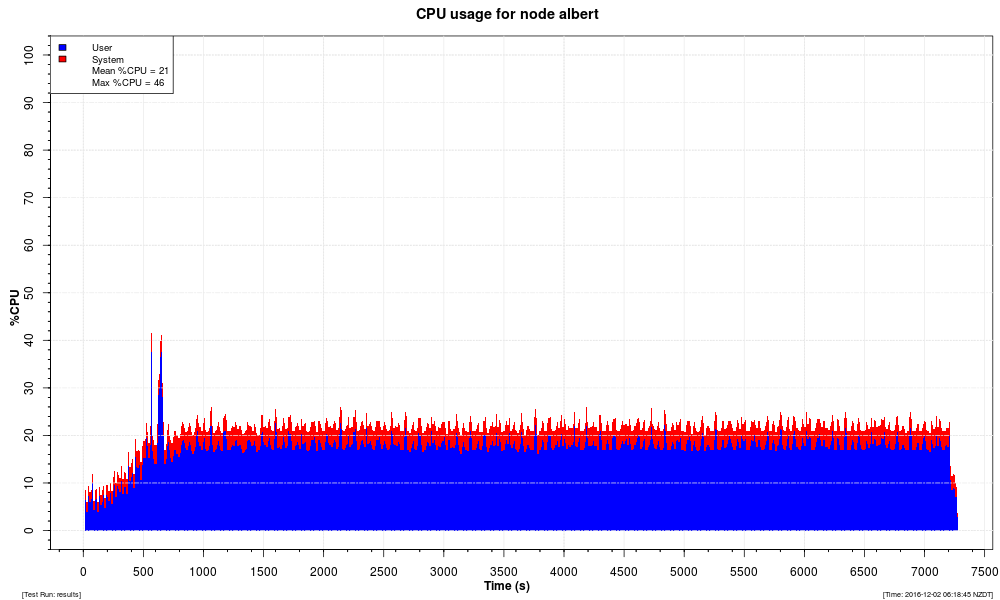
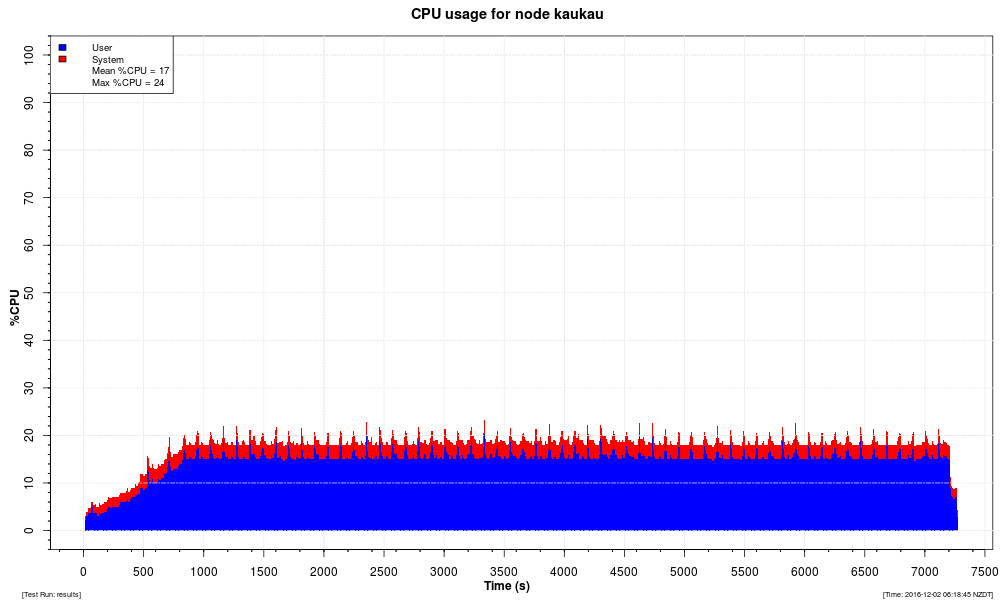
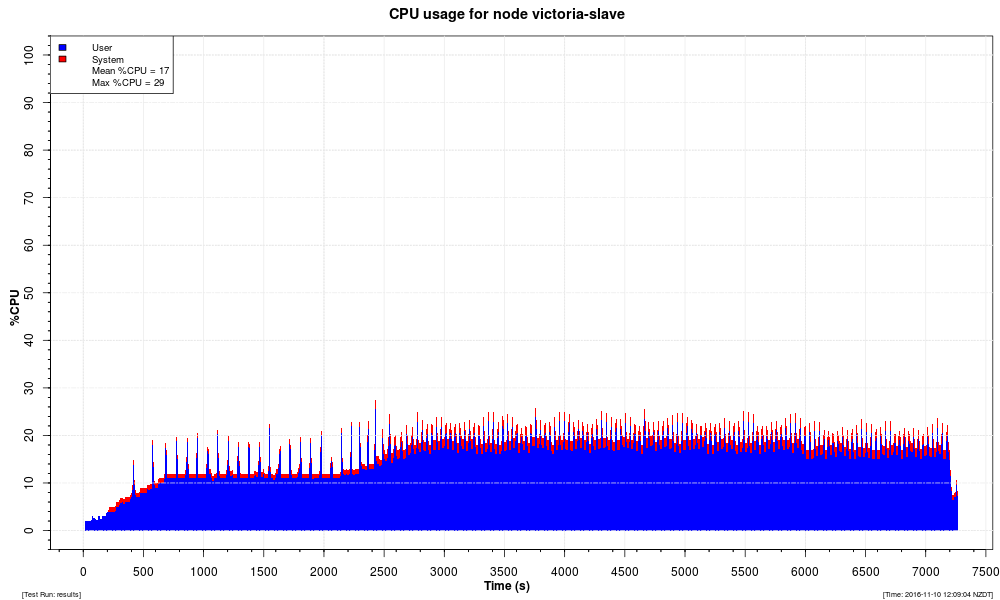
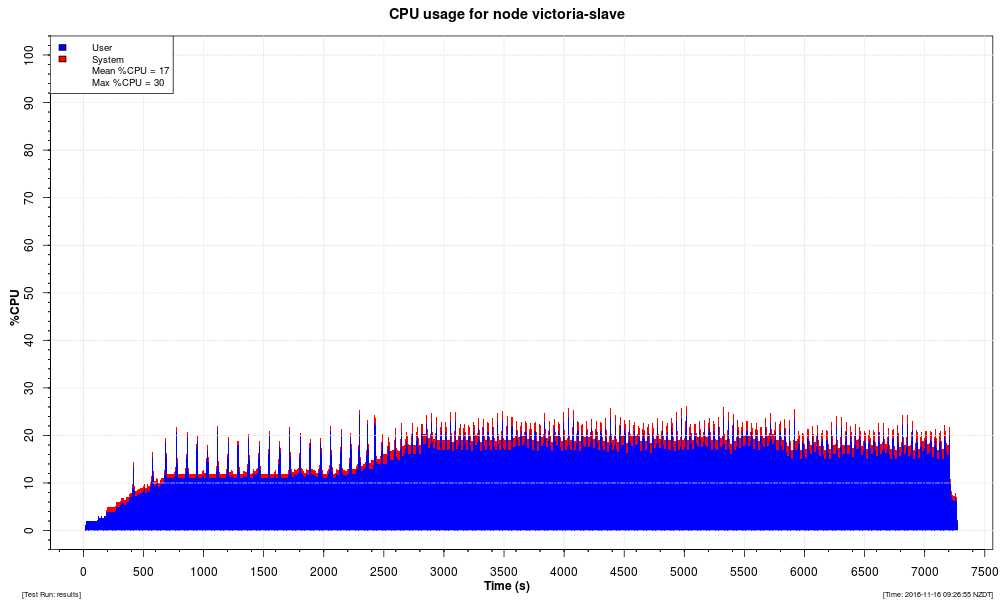
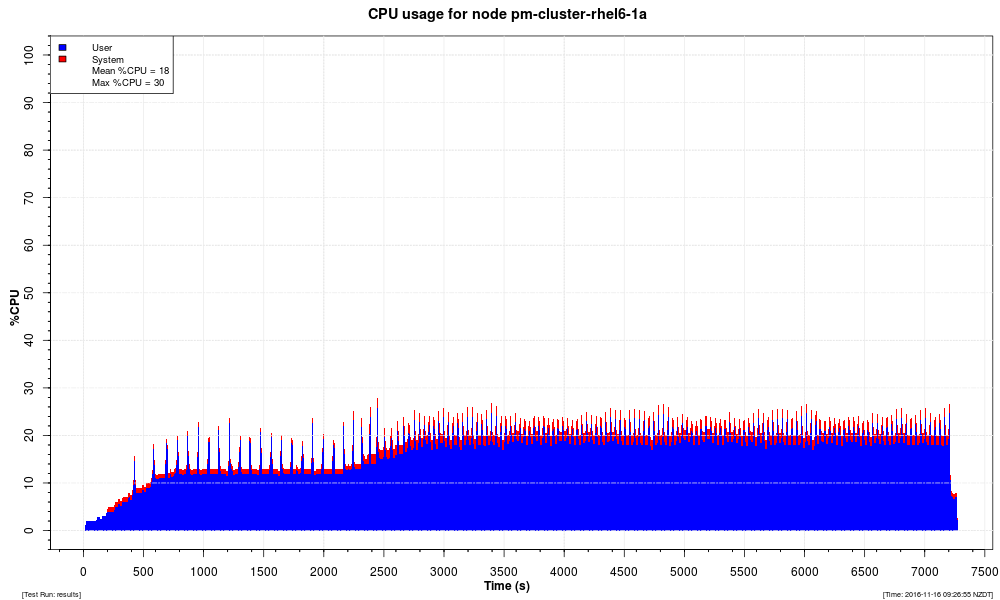
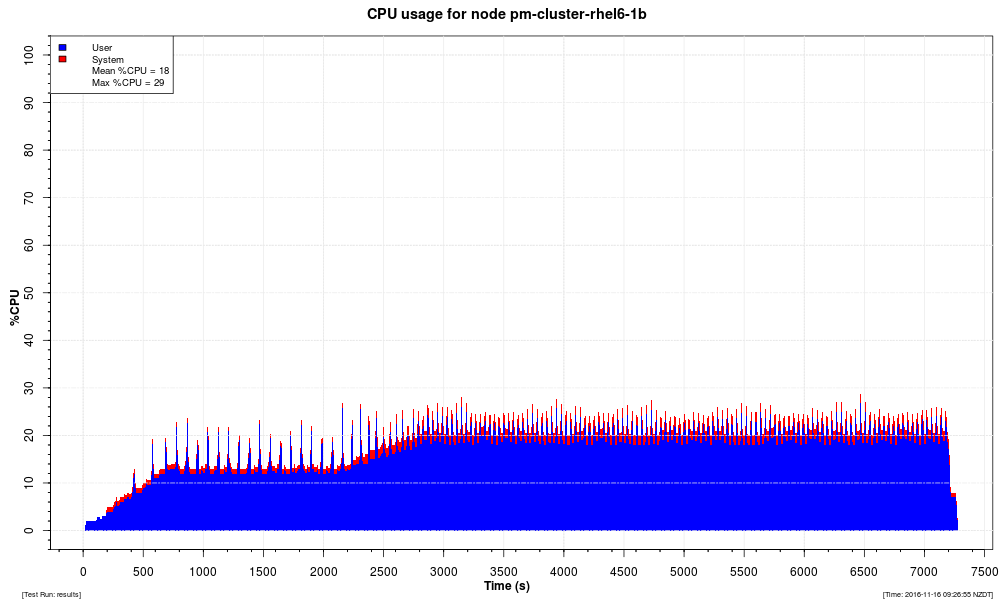
CPU Utilization |
Percentage of CPU used by Rhino nodes, as reported by the kernel. |
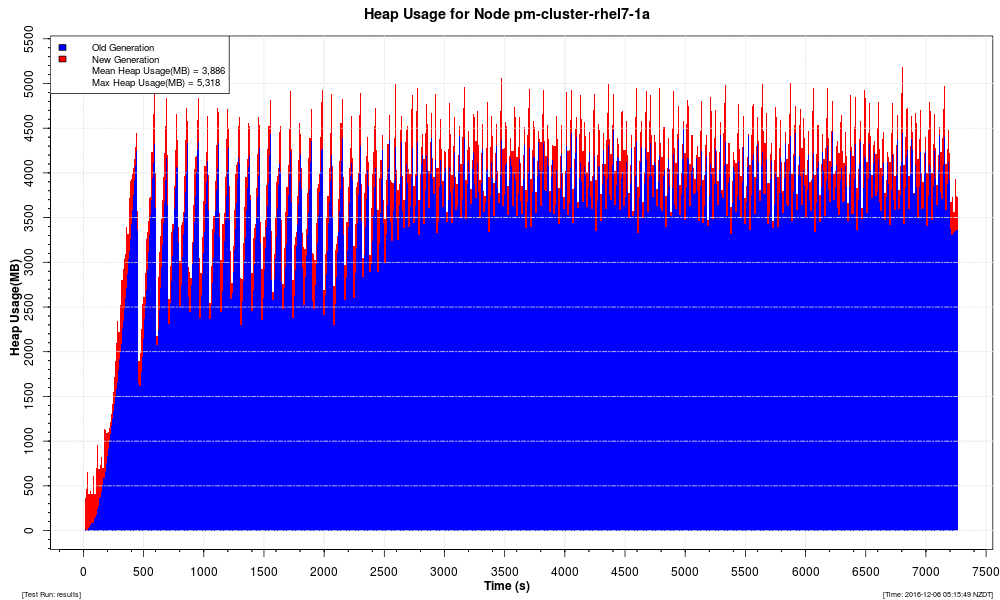
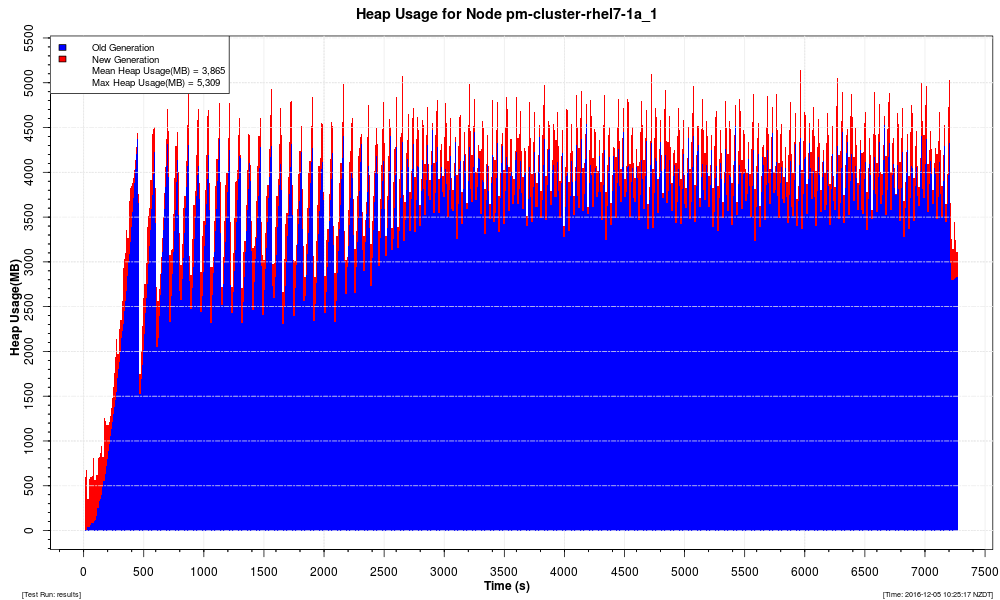
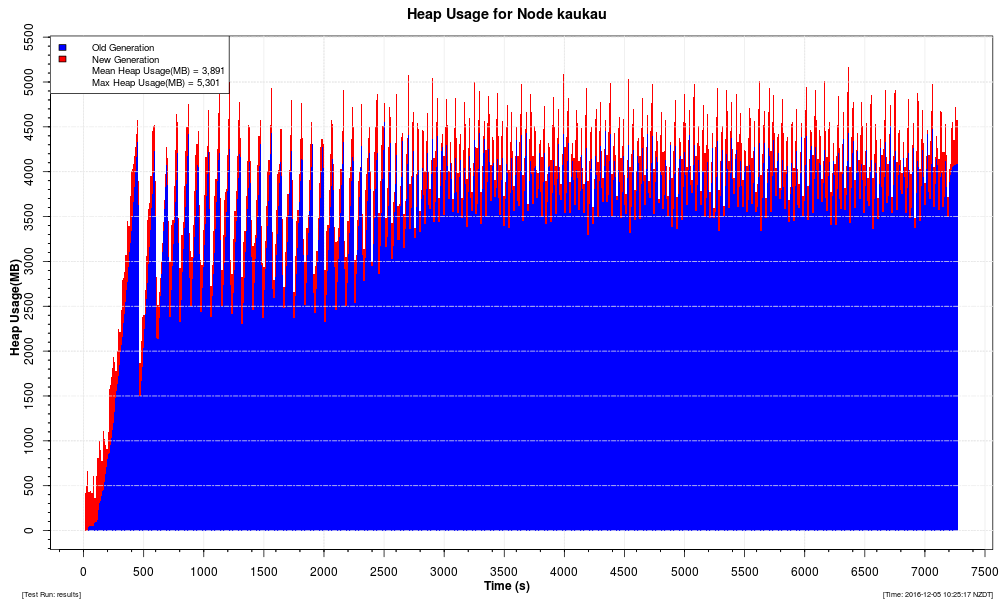
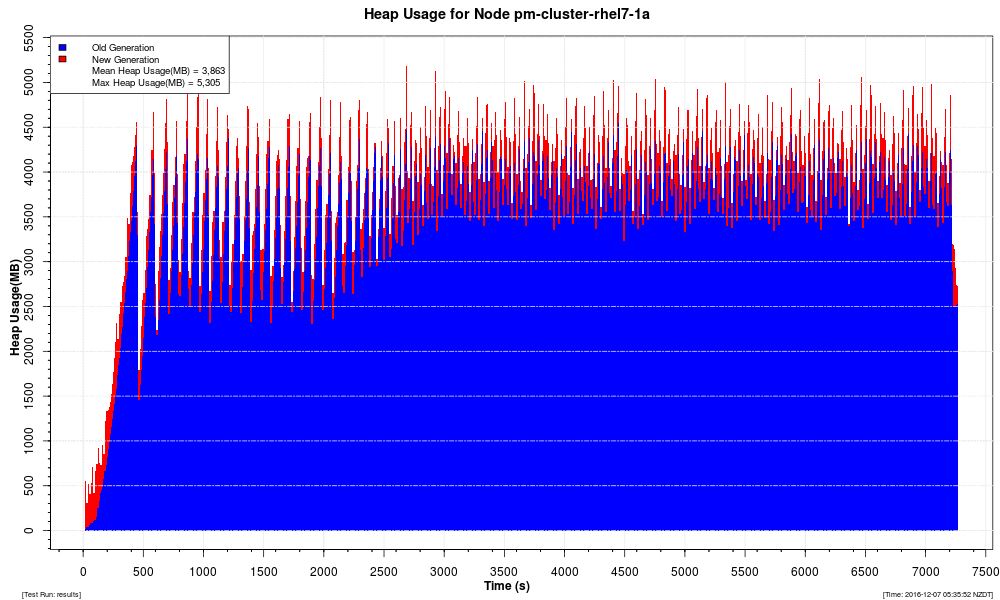
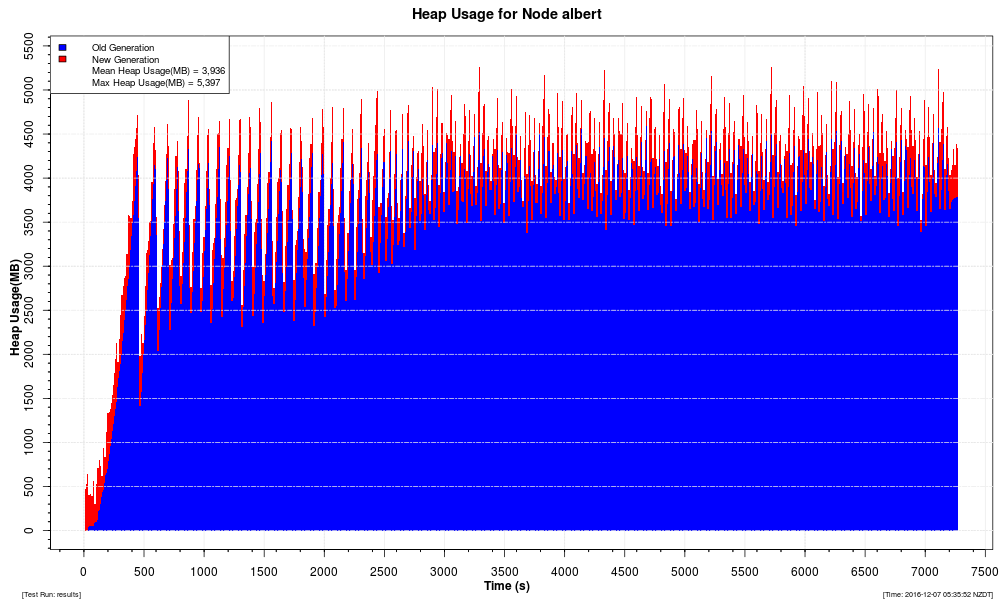
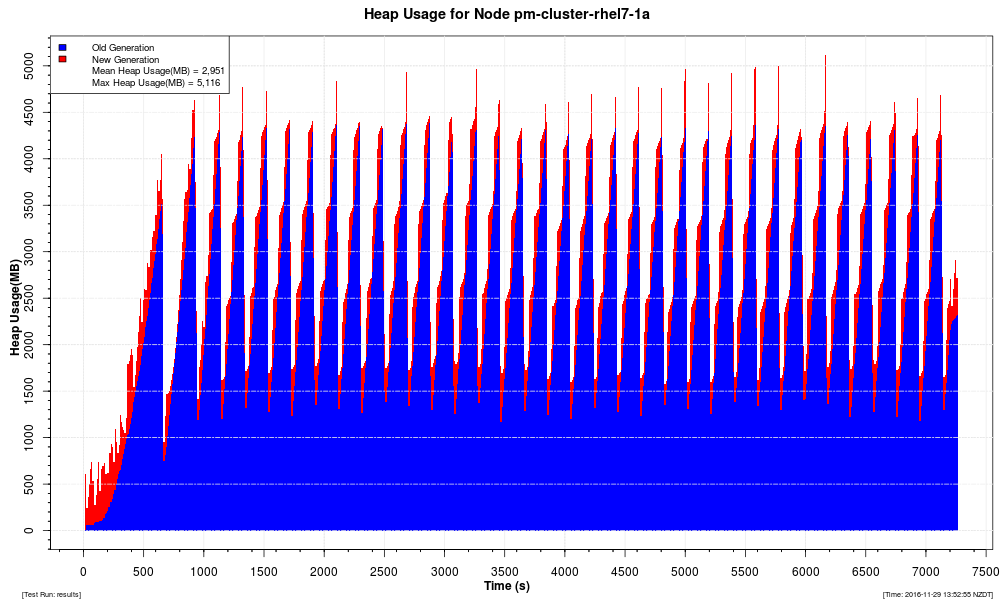
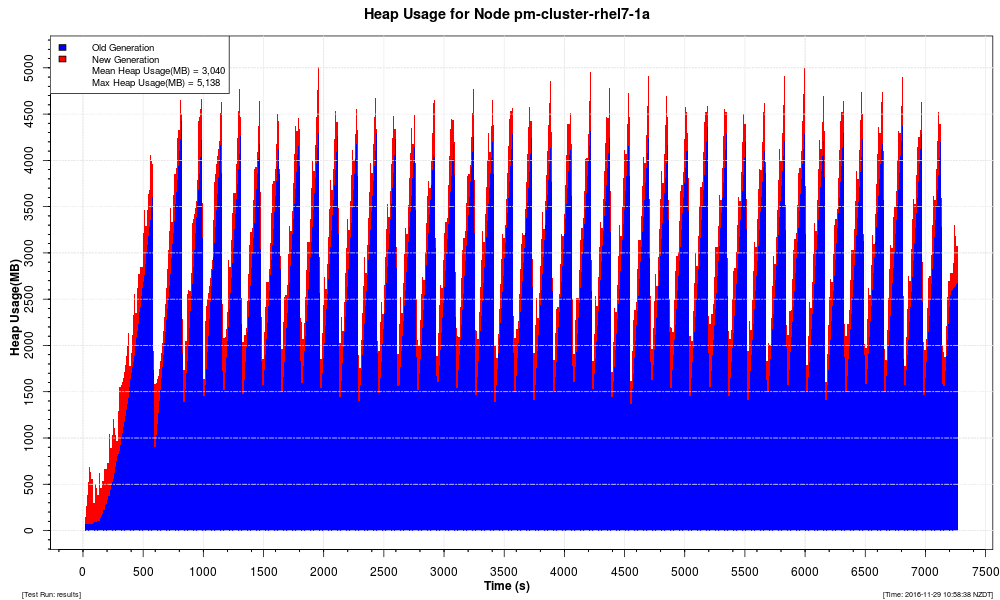
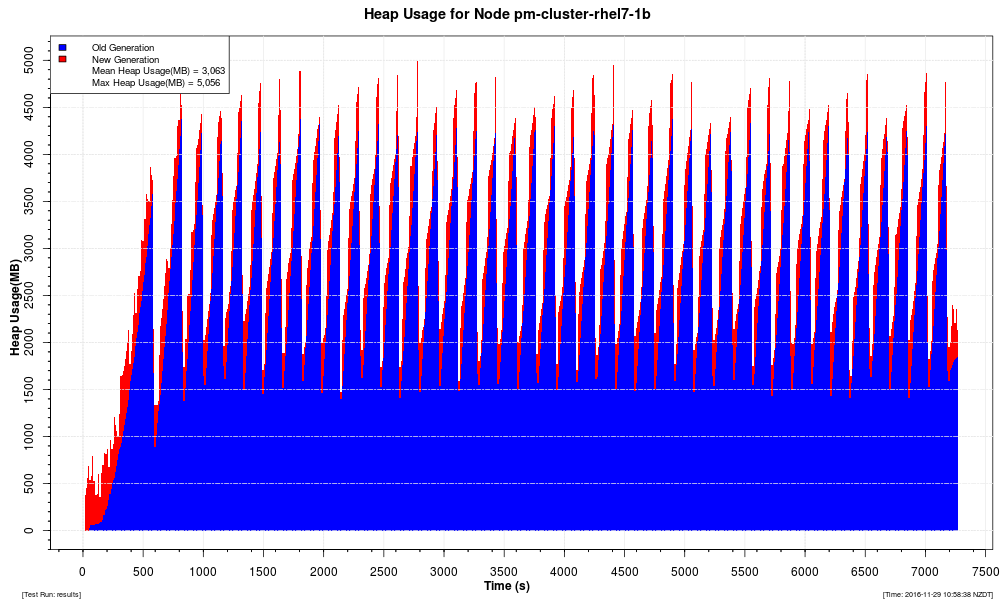
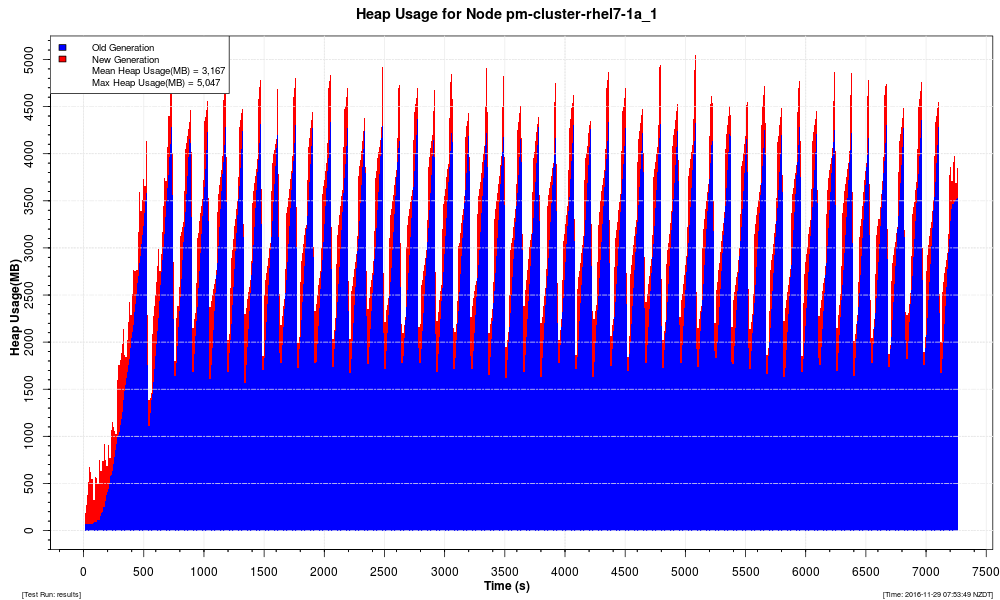
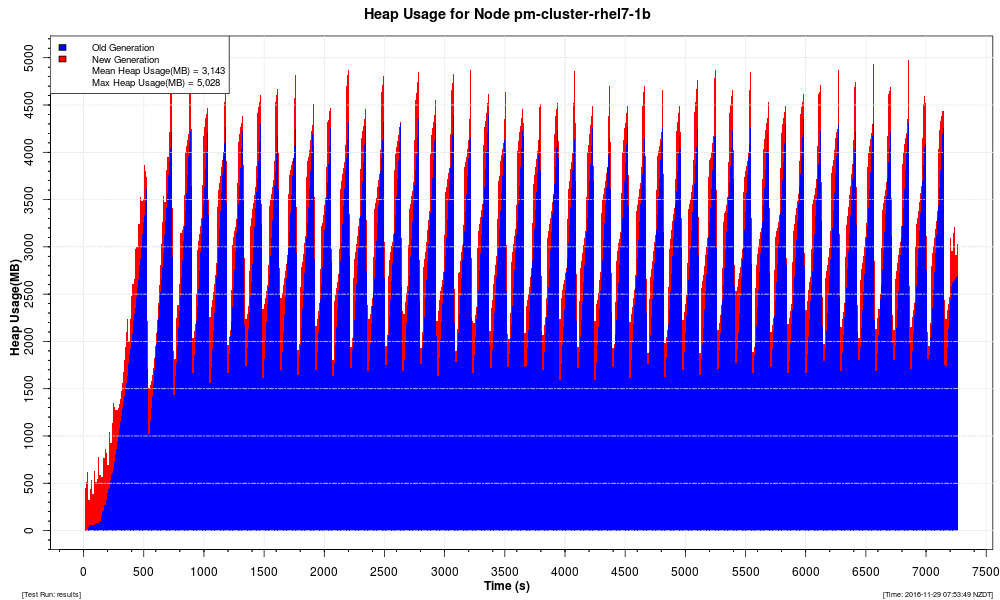
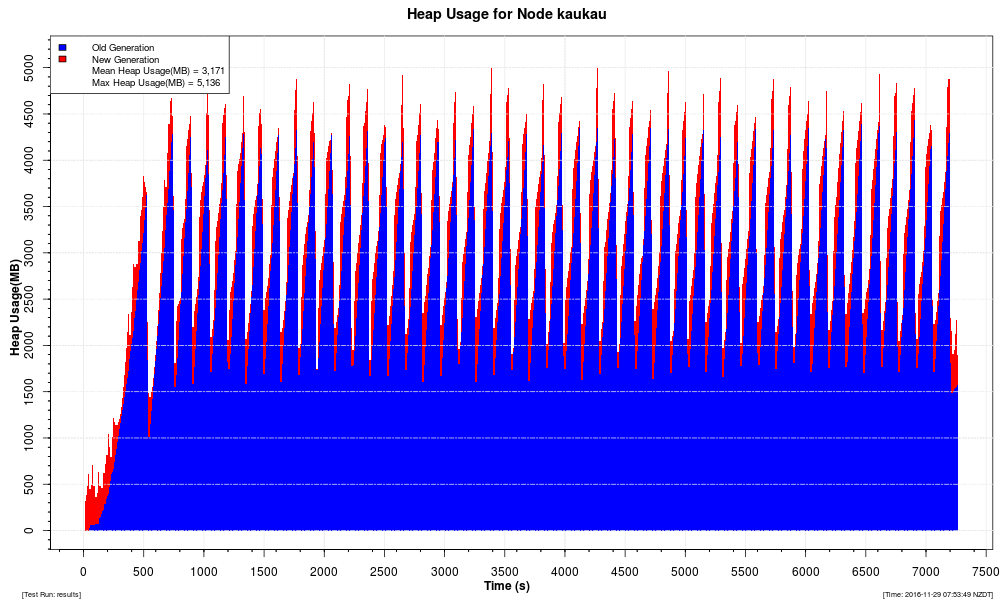
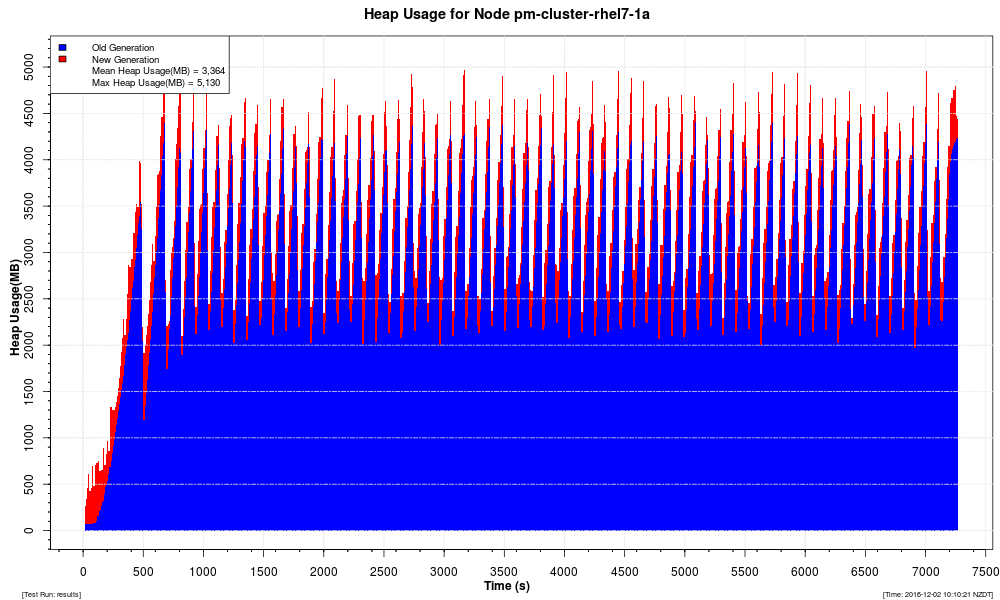
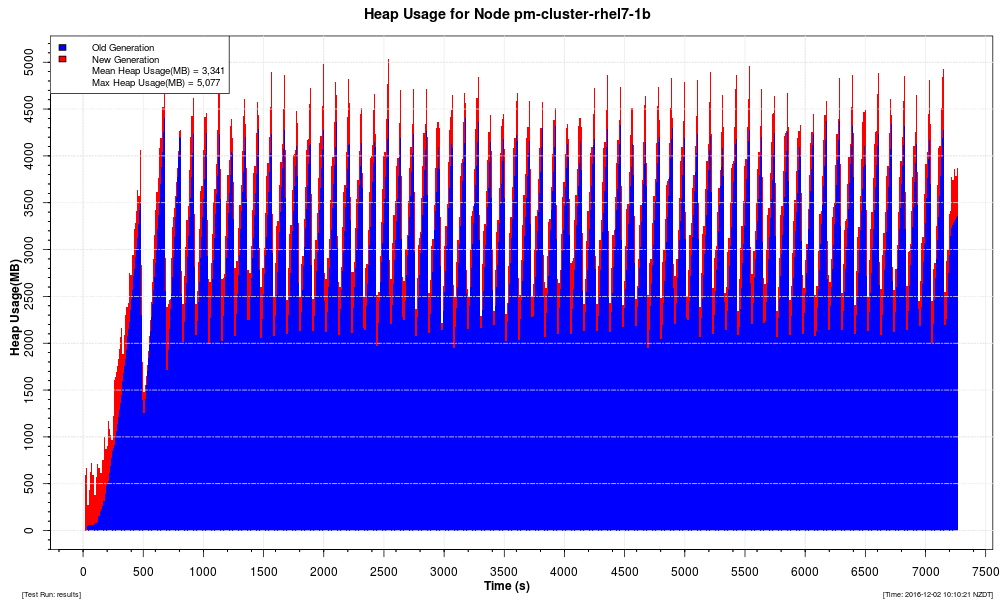
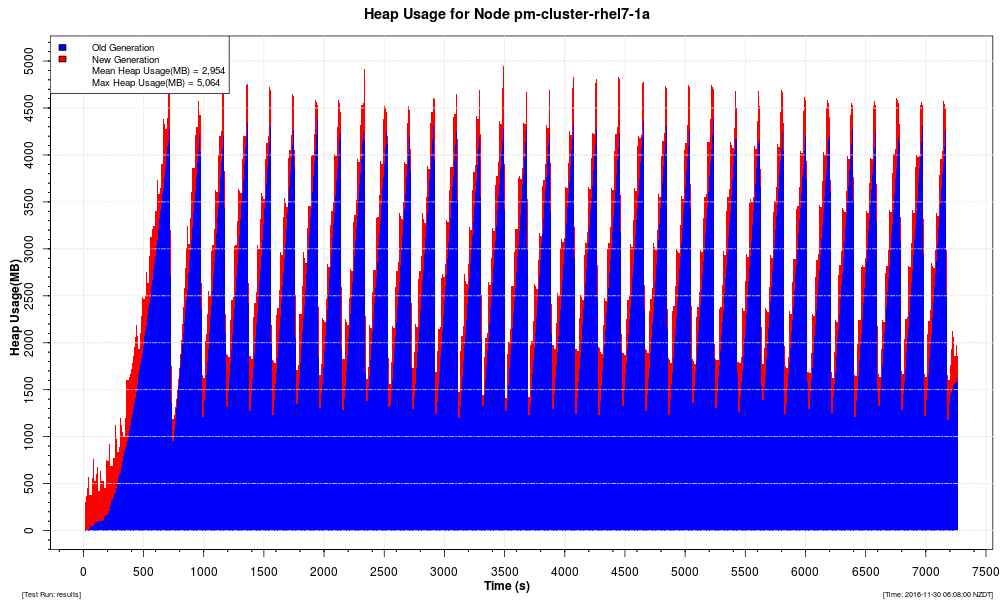
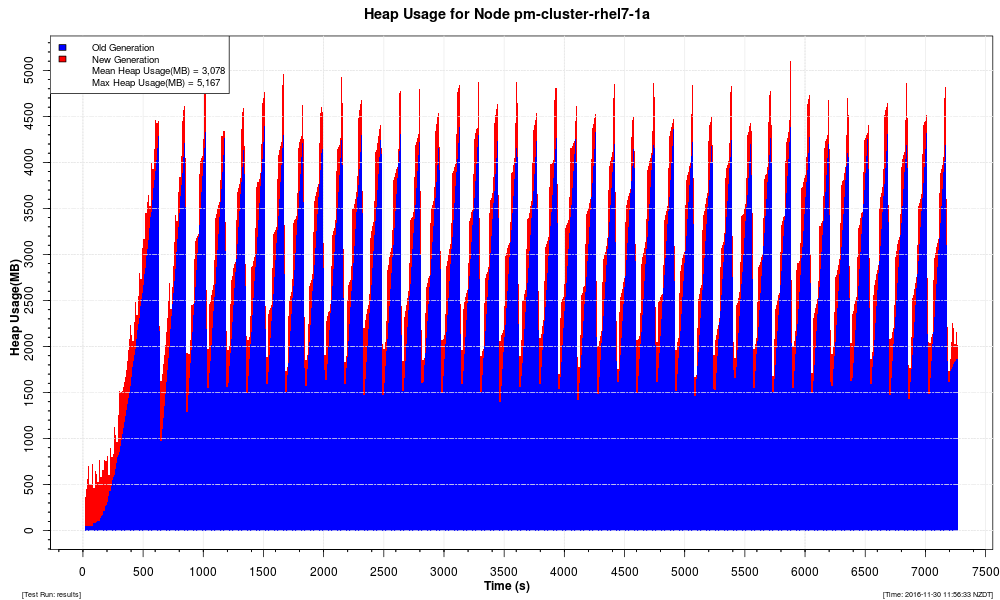
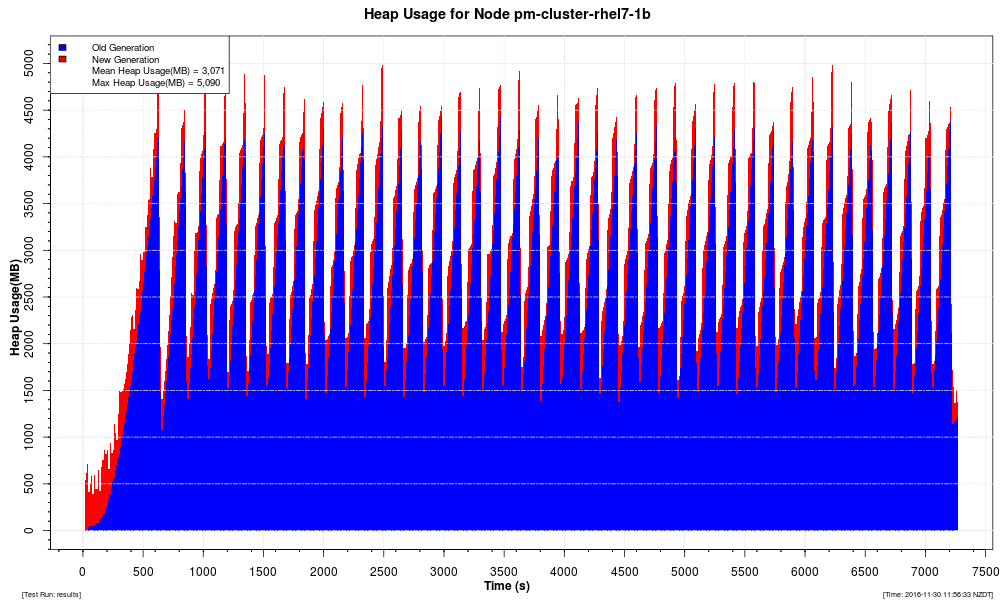
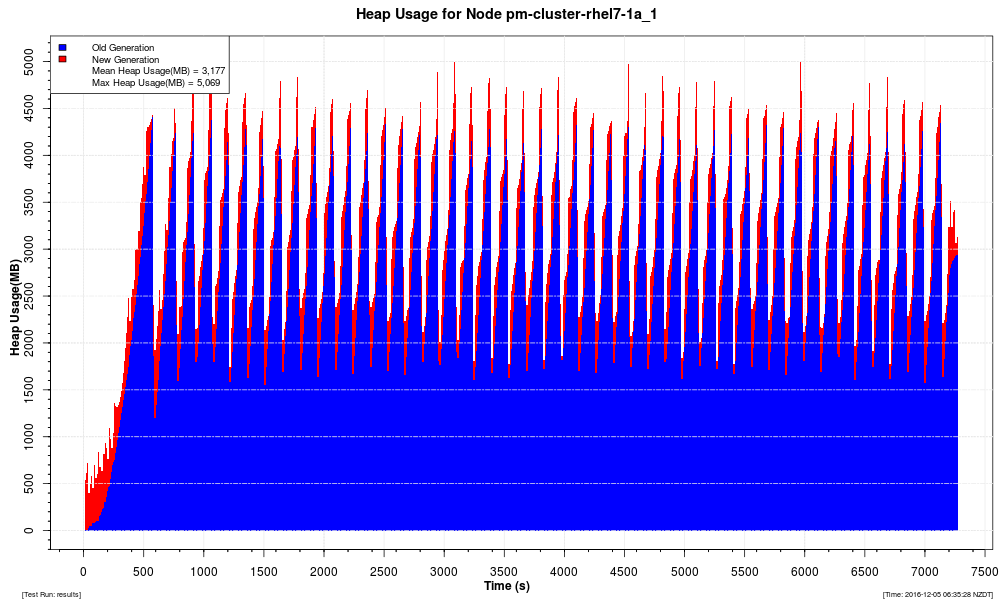
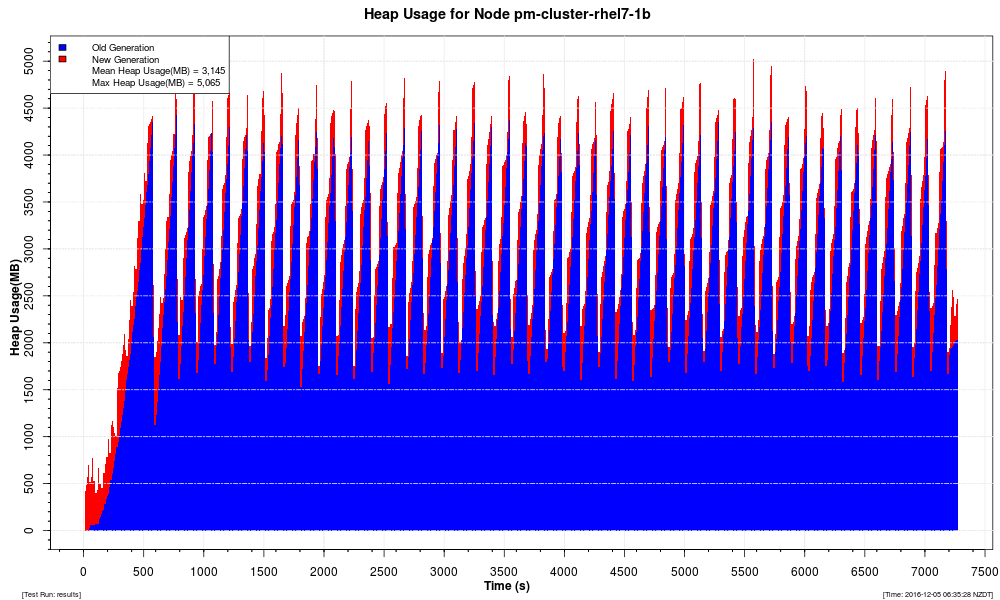
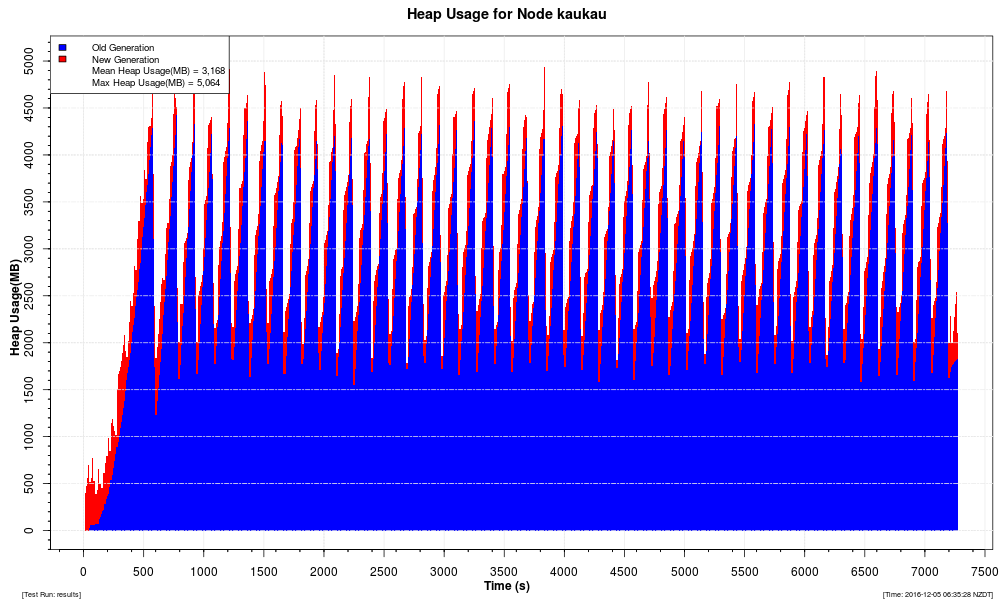
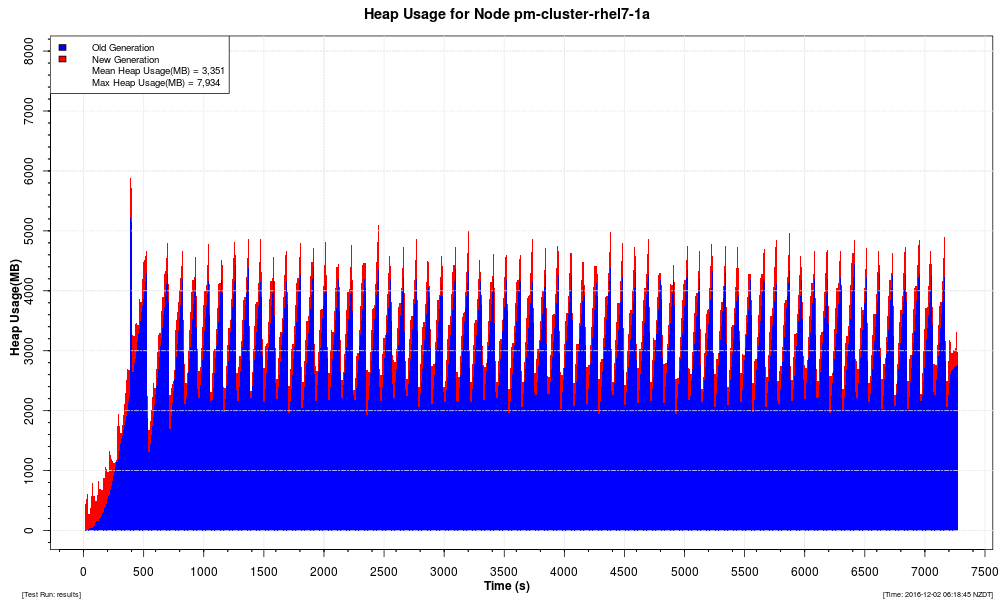
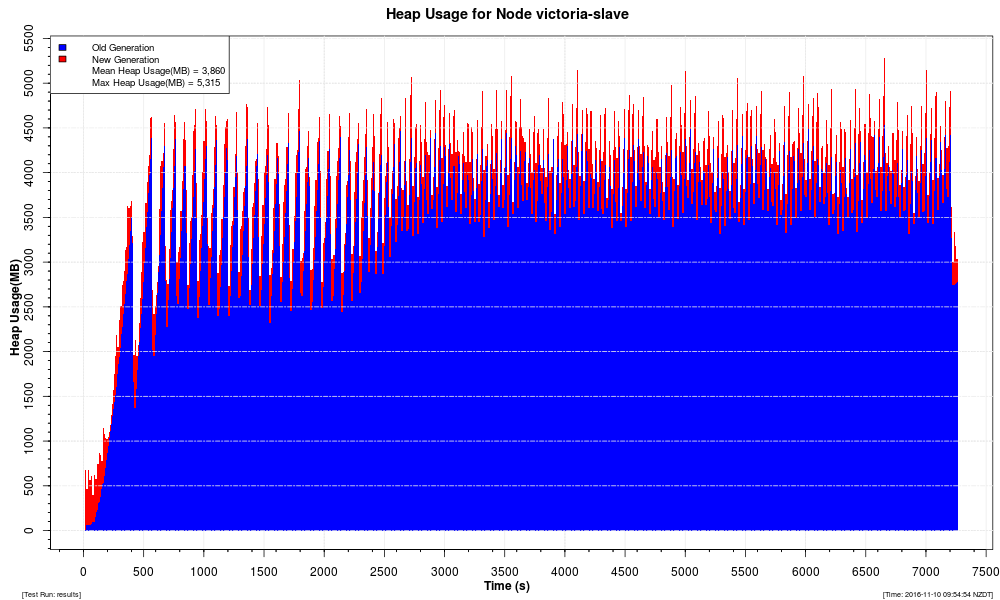
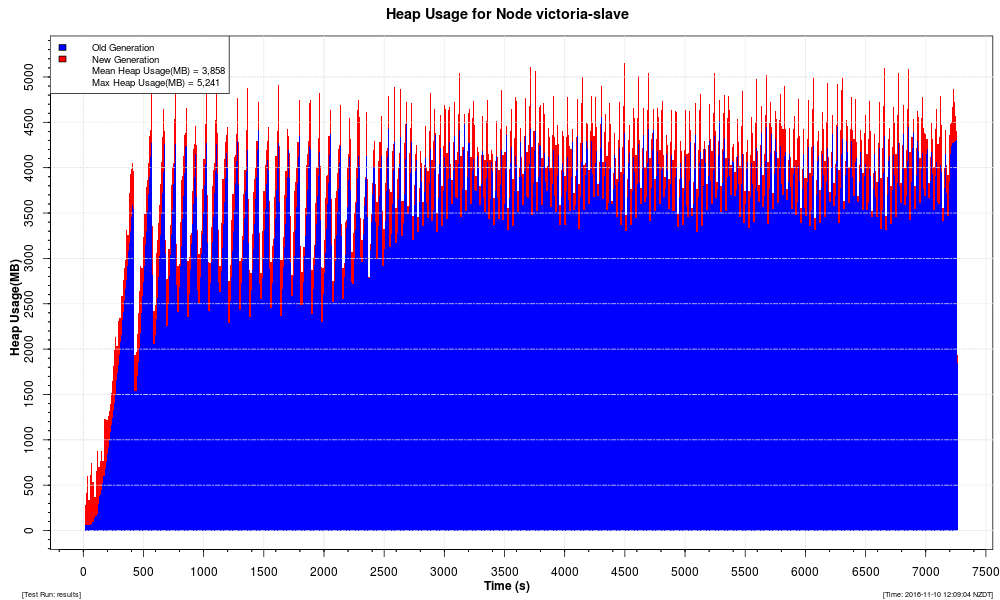
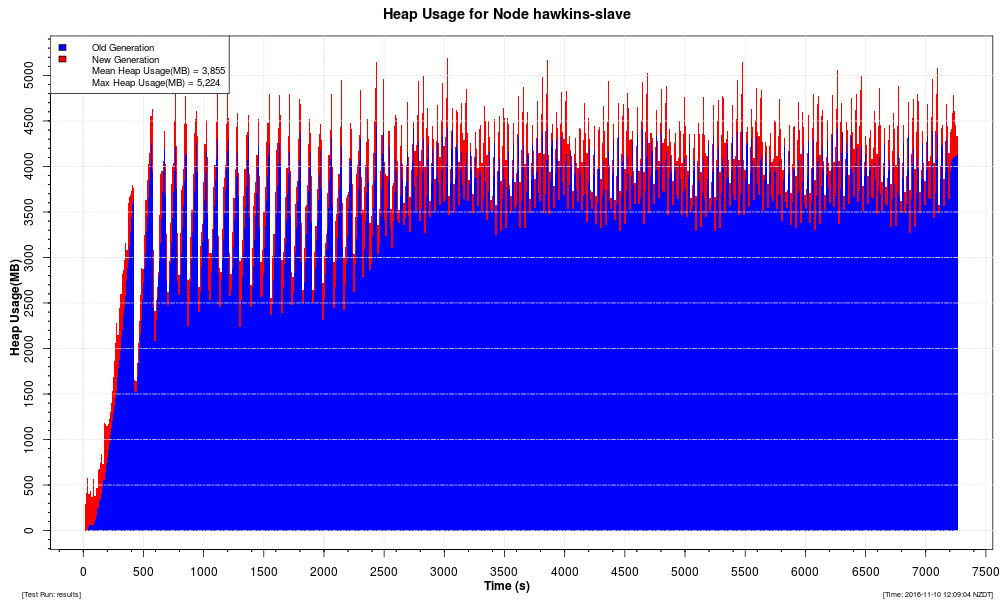
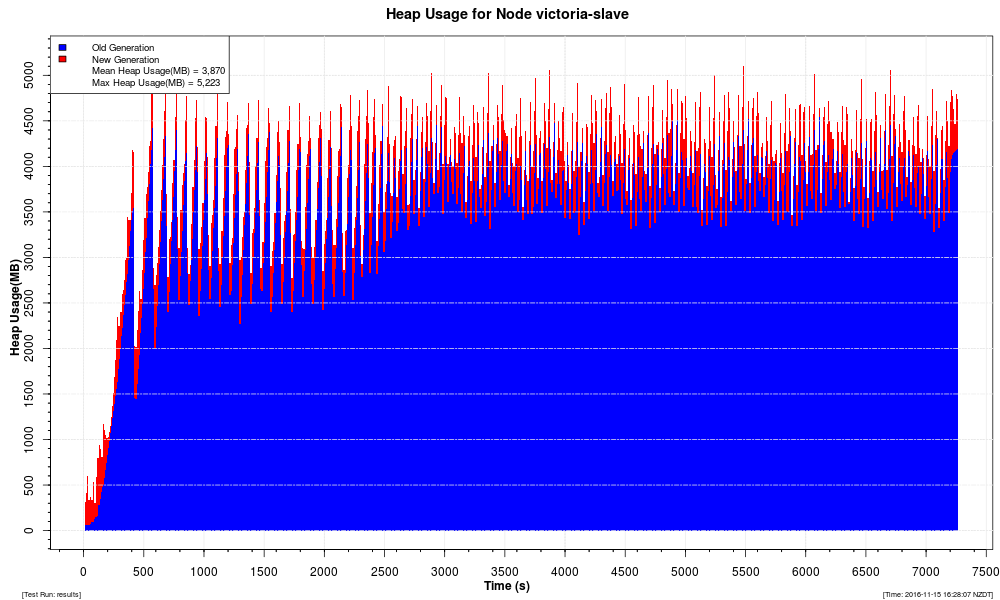
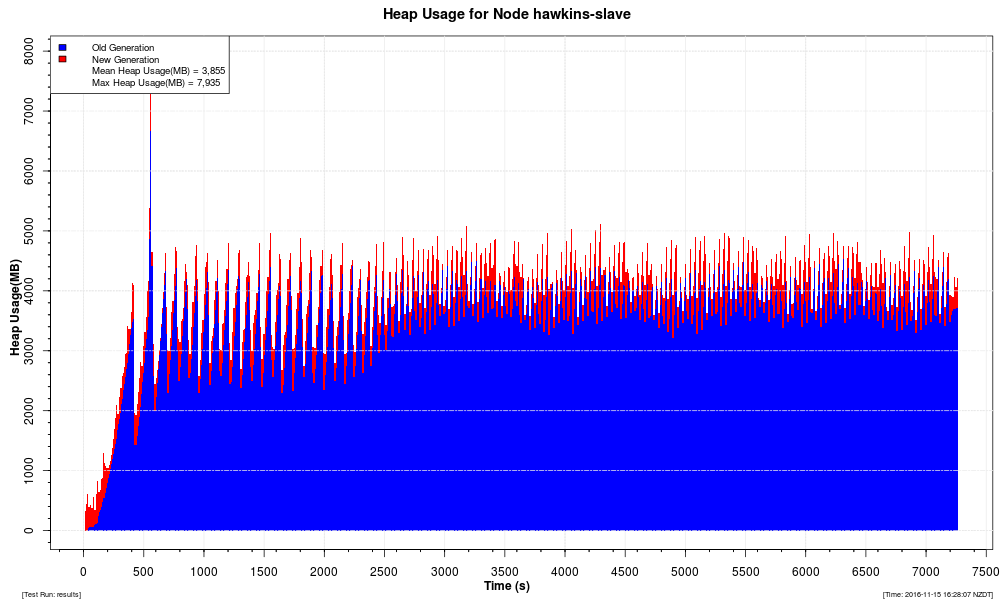
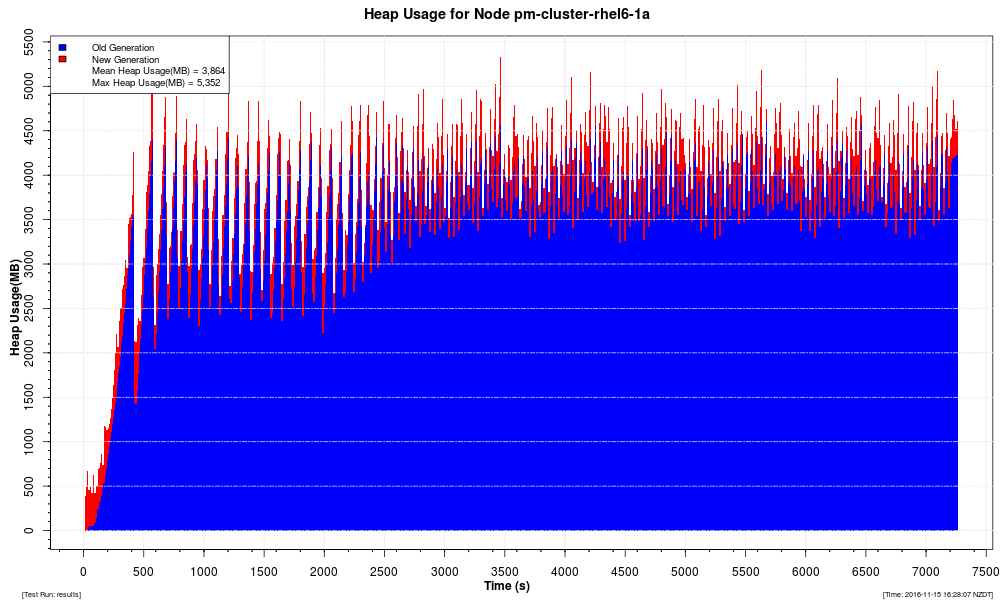
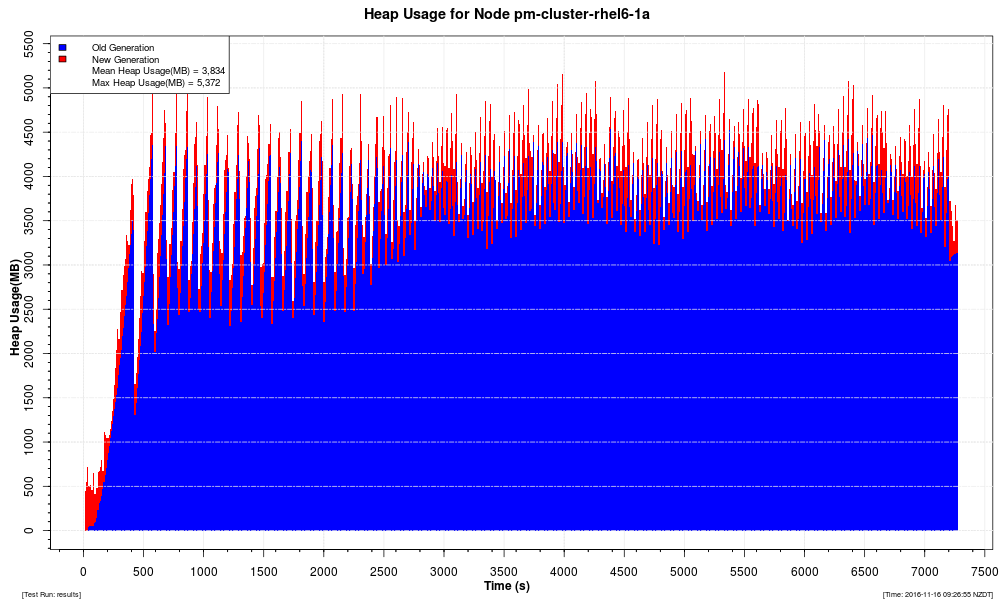
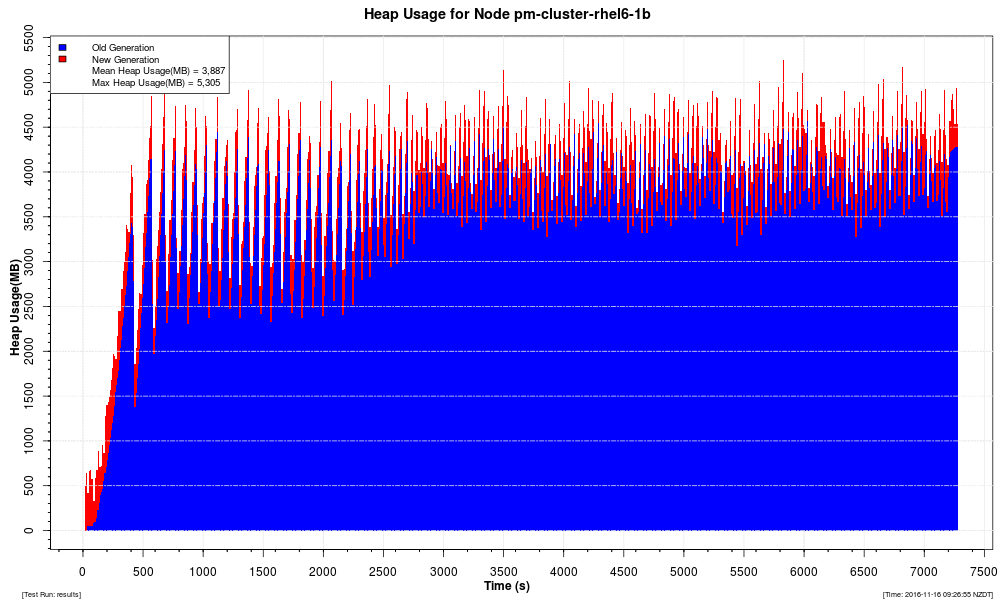
Heap |
Heap usage. |
Calculating number of dialogs
To calculate the number of dialogs (for example, using 8,000 calls per second):
-
All calls involve originating and terminating treatment (in our example, this means 16,000 dialogs).
-
10% of calls involve a query to the HLR (800 dialogs).
…for a total of 16,800 dialogs per second.
IN 1 Node Java 7 Results


IN 1 Node Java 8 Results


IN 2 Node Java 7 Results


IN 2 Node Java 8 Results


SIP Benchmarks
Below is an overview of how we test Rhino performance with SIP, followed by links to the benchmarks.
About the SIP test Scenario
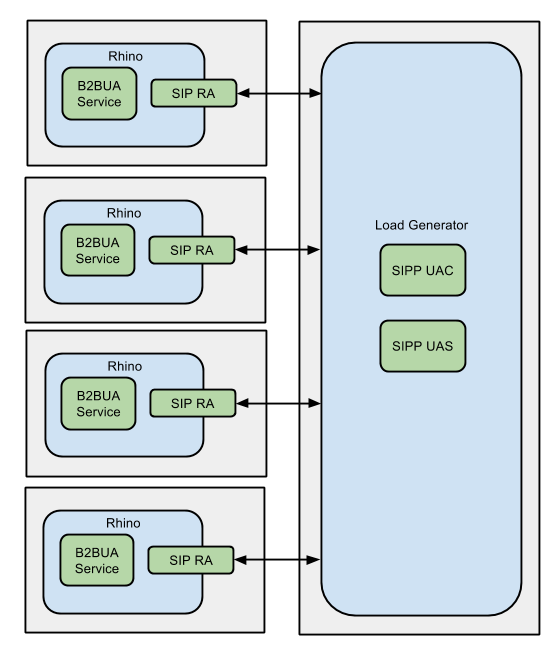
To test the SIP performance of Rhino, we used a "Back-to-Back User Agent", or B2BUA, a common building block in SIP services. The test B2BUA is a simple routing B2BUA, that forwards SIP messages between two SIP dialogs, implemented as a SLEE service using the OpenCloud SIP resource adaptor.
OpenCloud chose the B2BUA service as a SIP benchmark because it is fundamental to many SIP applications. The B2BUA sits between the caller and the callee, maintaining SIP dialog state for each party, for the duration of the session. Many applications can be implemented by adding features on top of a generic B2BUA component (such as the test example) — so the performance of this B2BUA is a true indicator of how real-world B2BUA-based applications should perform.
| |
The Rhino SDK distribution includes SIP examples of a B2BUA service and SIP RA. |
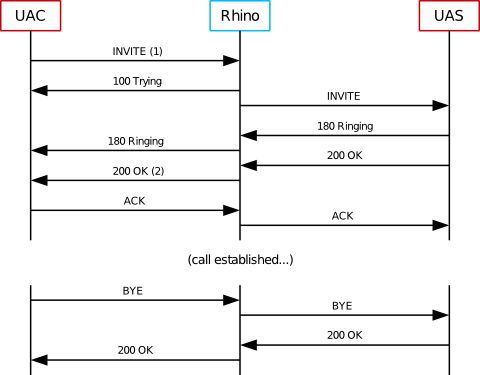
Call flow
| |
Measuring call setup time
The response time, or call-setup time, is the time taken between sending the initial INVITE (1) and receiving the 200 OK response (2), as measured by the UAC. |
The Rhino SIP Benchmarks are run using SIPP 3.2.
The following scripts were used to run the scenarios:
-
UAC script: uac-basic-call.xml
-
UAS script: uas-basic-call.xml
SIP Benchmark Environment and Configuration
Below are the hardware, software-ha, and Rhino configuration used for the Rhino benchmarks.
Hardware
The SIP HA and FT benchmark tests were run using configurations ranging from one node to four node clusters. Benchmarks are provided for both Java 7 and 8.
Two Java versions were used as there was significant modifications to garbage collection between Java 7 and 8.
The following hardware layout was used for the four node cluster tests.
| Machine | CPUs | RAM | OS |
|---|---|---|---|
|
1 |
2 x 6-core Xeon X5650 2.67GHz |
24G |
RHEL 7 |
|
2 |
2 x 6-core Xeon X5650 2.67GHz |
24G |
RHEL 7 |
|
3 |
2X Intel Xeon X5660 2.8GHz 12 core |
12G |
Centos 7 |
|
4 |
2X Intel Xeon X5660 2.8GHz 12 core |
12G |
Centos 7 |
Software (HA)
The SIP benchmark tests used the following software.
| Software | Version |
|---|---|
|
Java |
JDK 1.7.0_71 and JDK 1.8.0_60 |
|
Rhino |
Rhino 2.5.0.1 |
|
2.4.0.2 |
Rhino configuration
For the SIP benchmark tests, we made the following changes to the Rhino 2.4.0 default configuration.
| Parameter | Value | Note |
|---|---|---|
|
JVM Architecture |
64bit |
Enables larger heaps |
|
Heap size |
8192M |
|
|
New Gen size |
512M |
Increased from default of 128M to achieve higher throughput without increasing latency |
|
Staging queue size |
5000 |
Increased from default of 3000 to allow burst traffic |
|
Worker Pool size |
120 |
|
|
Worker Queue size |
1000 |
|
|
Transport |
TCP |
|
|
Staging threads |
400 |
Increased from default of 30 for reduced latency at high throughput |
|
Local Memory DB size |
200M |
Increased from default of 100M to allow more in-flight calls |
SIP Benchmark Results Using FT
Benchmarks were performed for both Java 7 and Java 8, as rhino is currently certified on both versions.
Notes
Below are notes about the test procedure and types of graphs in the results.
Test procedure
-
All tests used TCP as the SIP transport.
-
Calls were evenly distributed between all available cluster nodes.
-
All calls had a duration of 60s.
-
Benchmarks were taken over a two hour test run.
Types of graphs
The individual test results include four types of graphs:
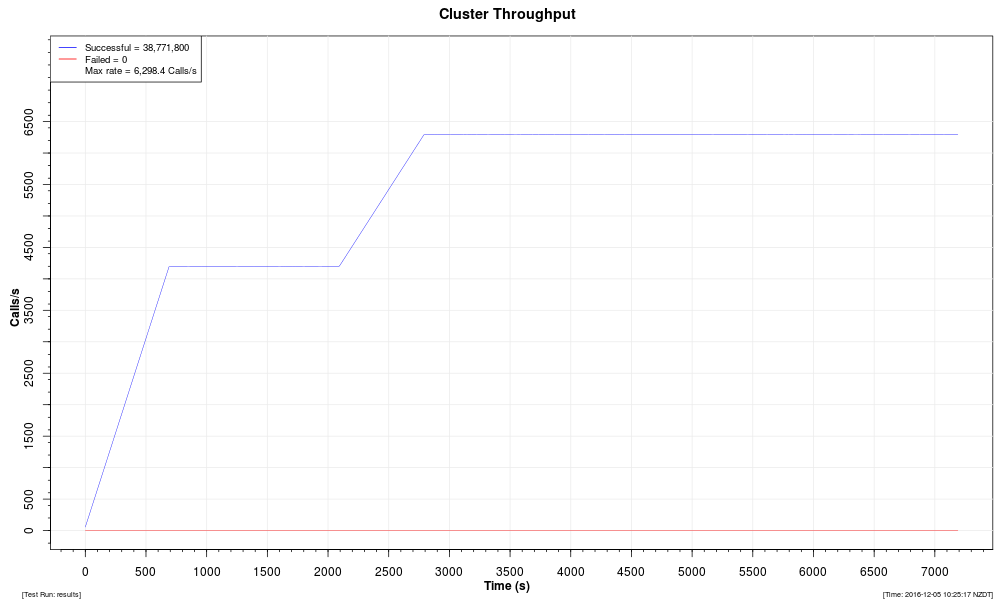
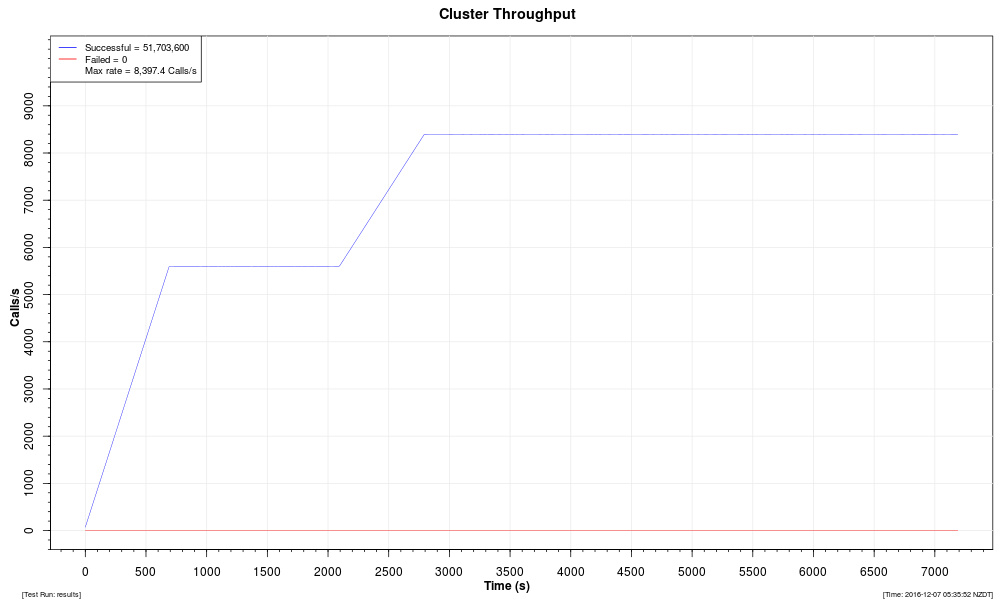
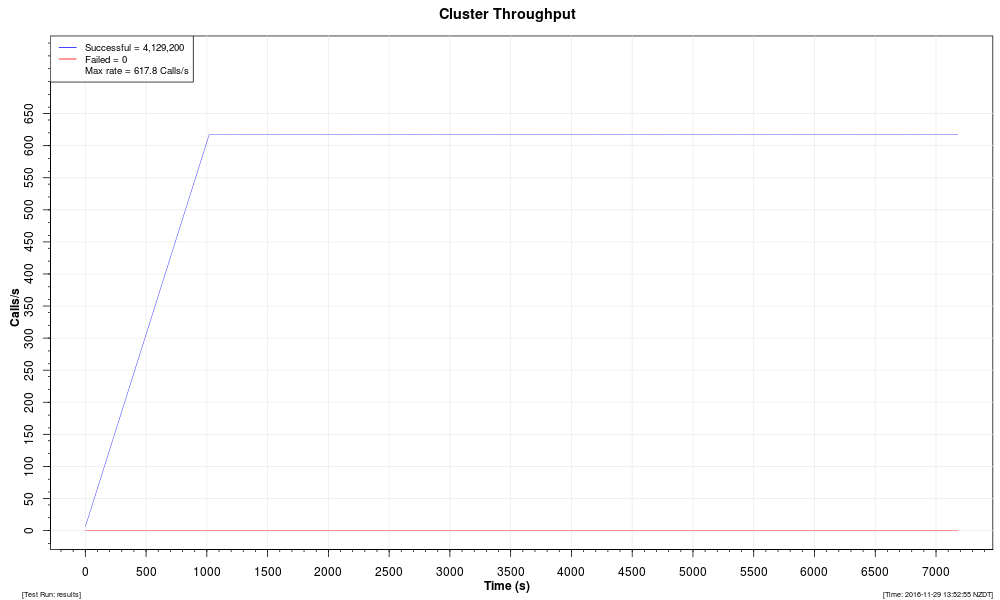
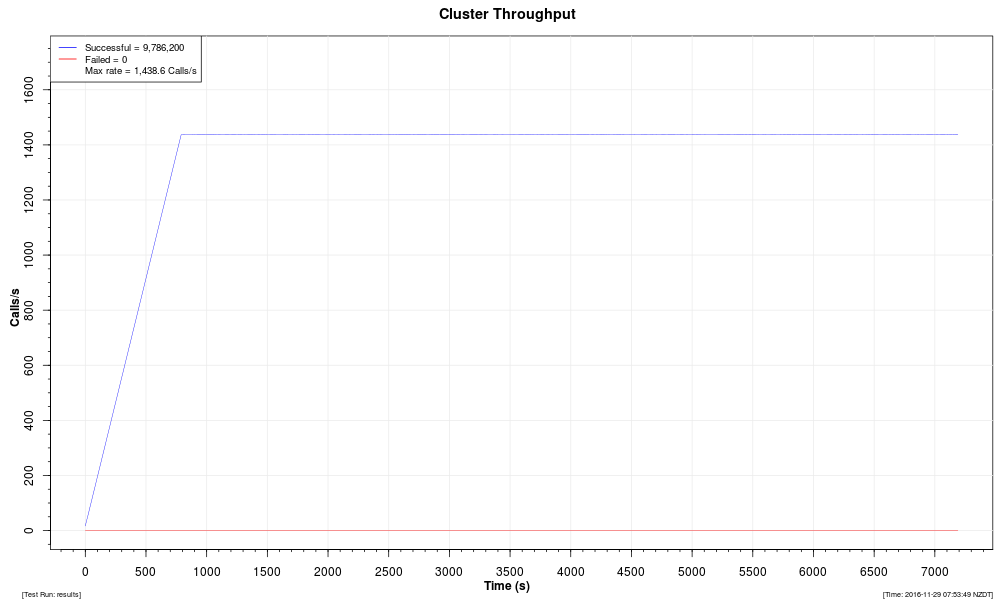
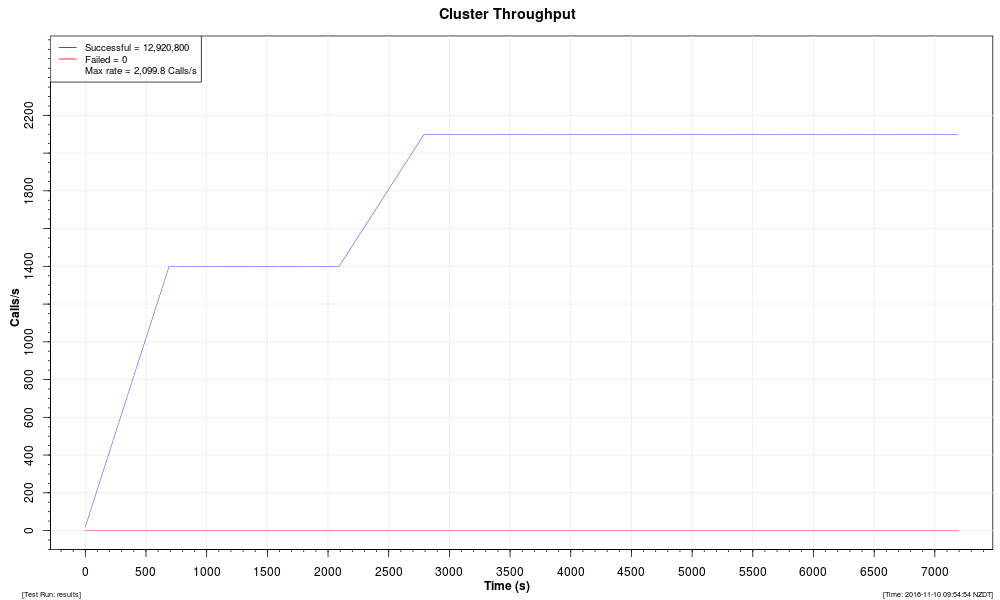
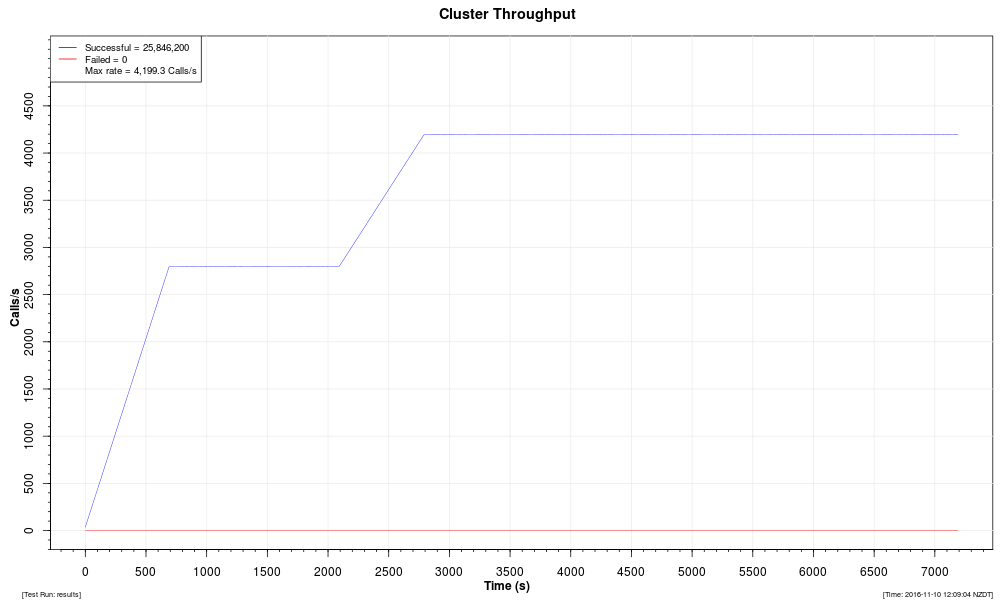
Throughput |
Total throughput (calls per second) of a cluster over the course of the test run. The "ramp-up" period at the start of each run is required because the load generators are Java programs, which need time for the JVM to perform its compilation and optimisation of Java code. (If we did not use a ramp-up period, the load generators would be overloaded initially, which would skew the results.) |
|---|---|
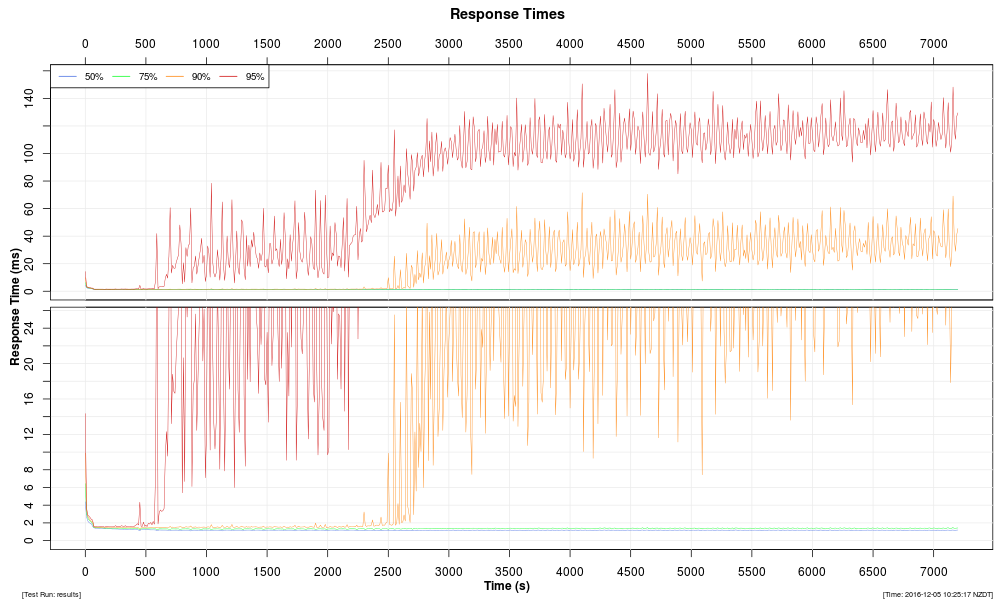
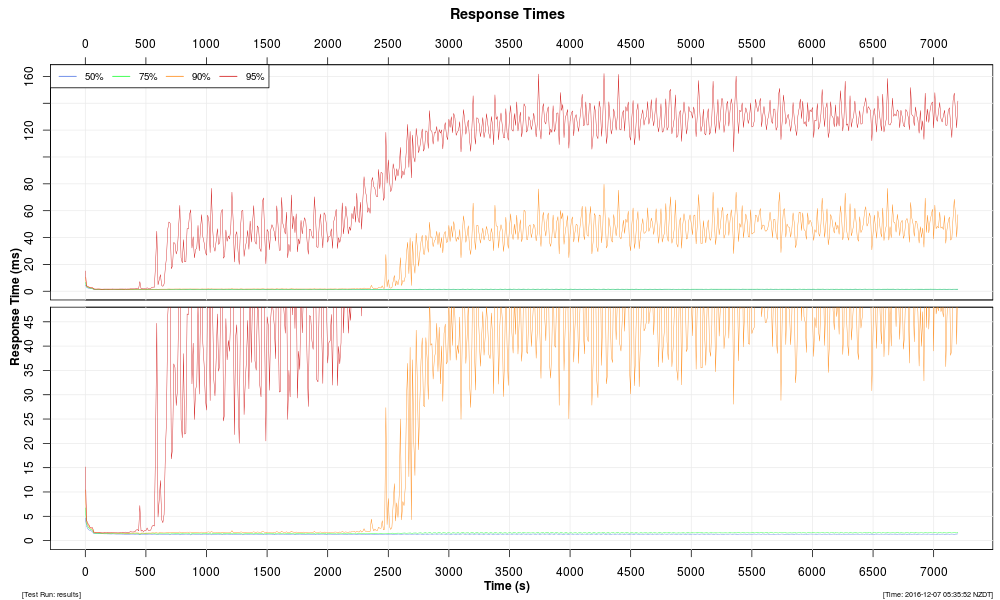
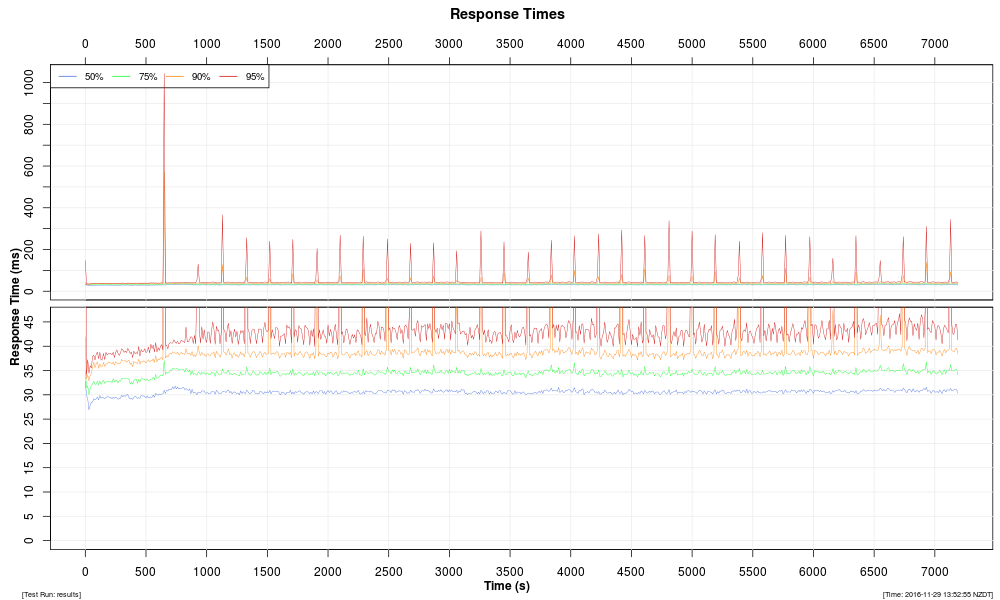
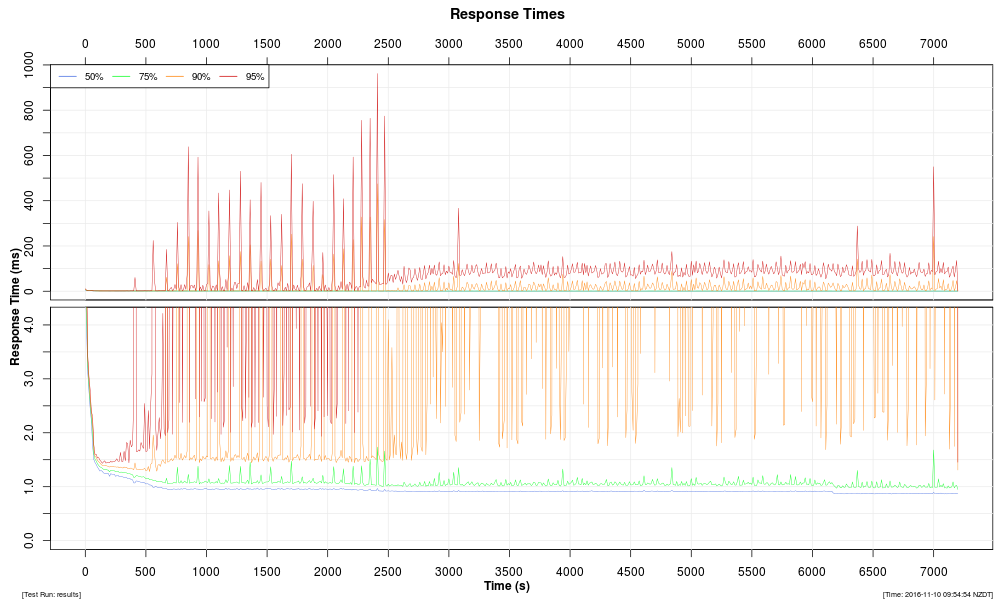
Response Times |
Distribution of response-time changes during the course of the test run. |
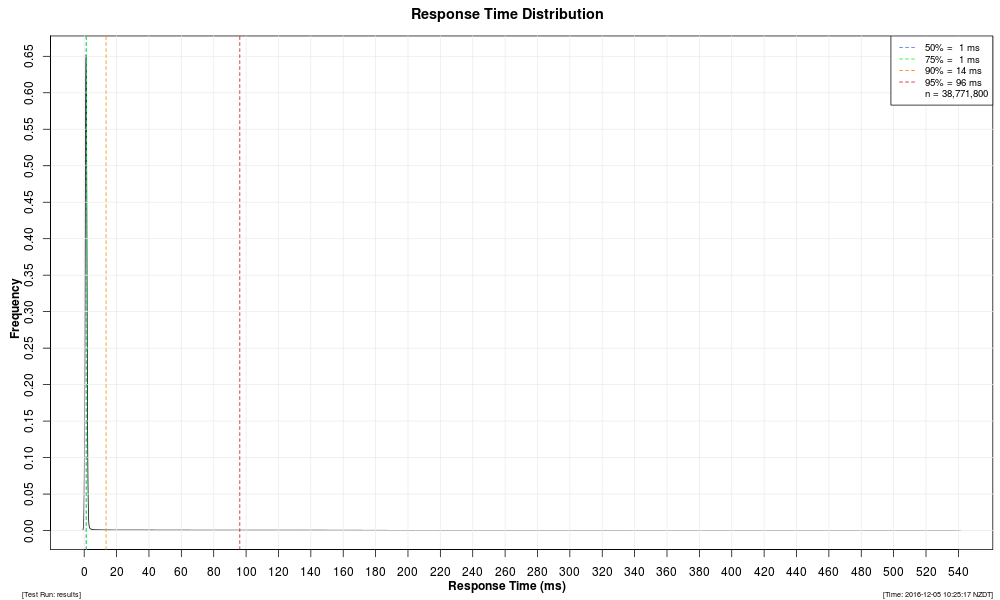
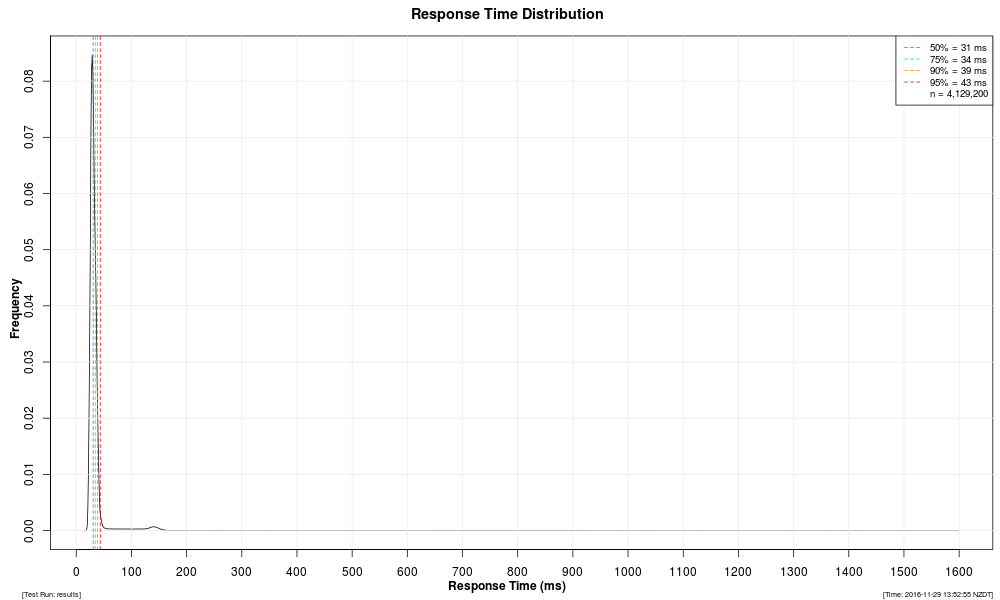
Response Time Distribution |
Overall distribution of response times from the entire test run. |
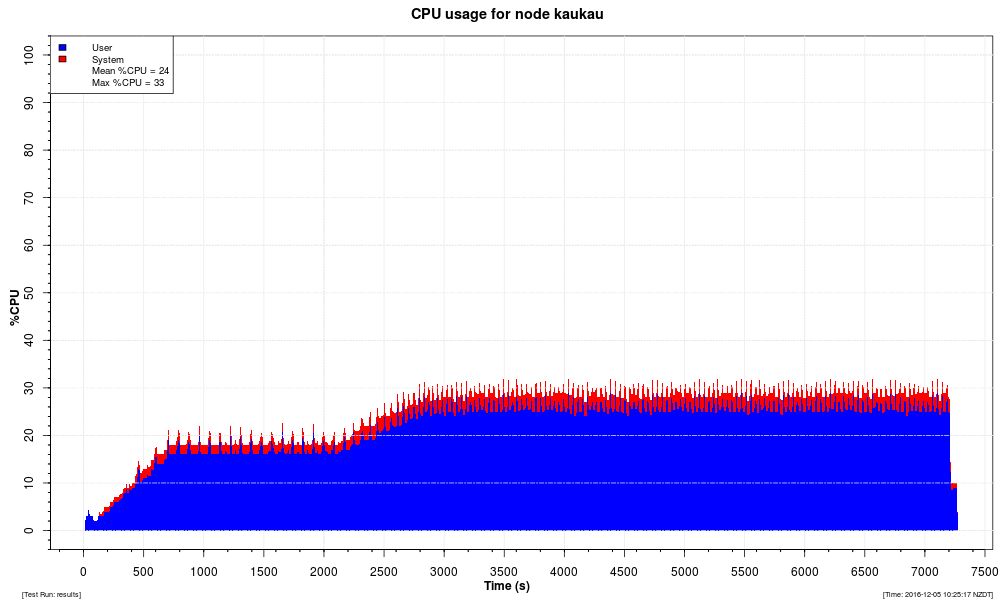
CPU Utilization |
Percentage of CPU used on Rhino servers, as measured by |
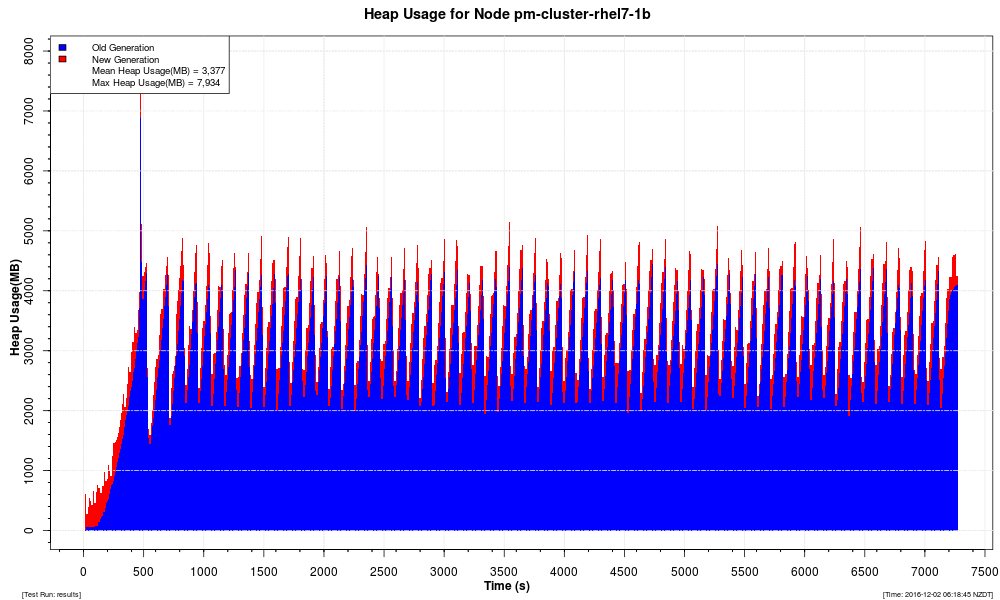
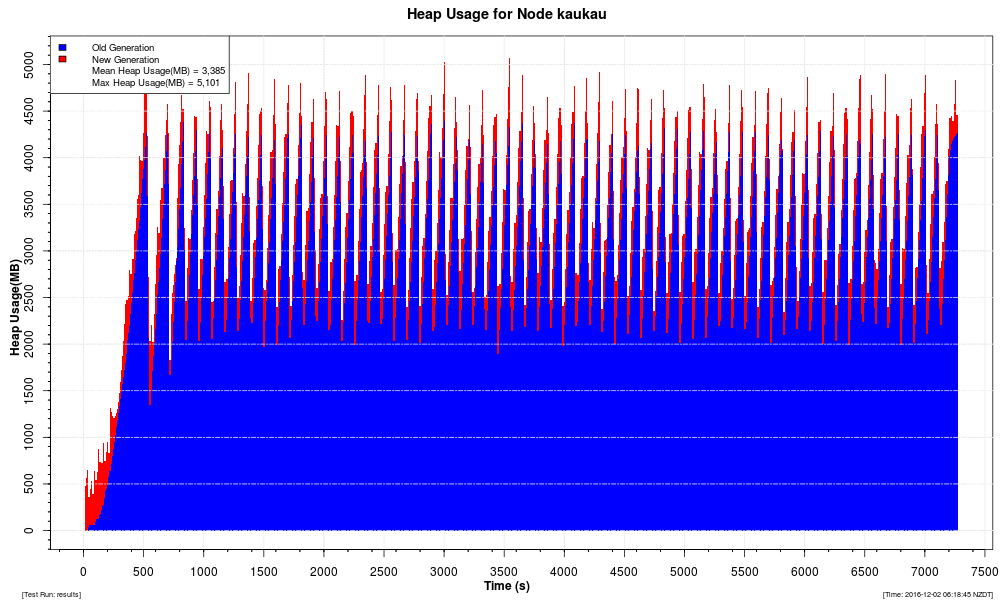
Heap |
Heap usage. |
SIP Benchmark Results Using FT on Java 7
Below is a summary of the Java 7 results.
Summary
| Cluster size | Call Rate | Event Rate | SIP message Rate | Results |
|---|---|---|---|---|
|
One node |
617 |
3702 events/s |
8021 messages/s |
|
|
Two nodes |
1091 |
6546 events/s |
14,183 messages/s |
|
|
Three nodes |
1438 |
8628 events/s |
18,694 messages/s |
|
|
Four nodes over two domains |
1990 |
11,940 events/s |
25,870 messages/s |
Types of graphs
The individual test results include four types of graphs:
Throughput |
Total throughput (calls per second) of a cluster over the course of the test run. The "ramp-up" period at the start of each run is required because the load generators are Java programs, which need time for the JVM to perform its compilation and optimisation of Java code. (If we did not use a ramp-up period, the load generators would be overloaded initially, which would skew the results.) |
|---|---|
Response Times |
Distribution of response-time changes during the course of the test run. |
Response Time Distribution |
Overall distribution of response times from the entire test run. |
CPU Utilization |
Percentage of CPU used on Rhino servers, as measured by |
Heap |
Heap usage. |


SIP 4 Node Results Using FT and 2 Domains on Java 7


SIP Benchmark Results Using FT on Java 8
Below is a summary of the Java 8 results.
Summary
| Cluster size | Call Rate | Event Rate | SIP message Rate | Results |
|---|---|---|---|---|
|
One node |
617 |
3702 events/s |
8021 messages/s |
|
|
Two nodes |
1091 |
6546 events/s |
14,183 messages/s |
|
|
Three nodes |
1438 |
8628 events/s |
18,694 messages/s |
|
|
Four nodes over two domains |
1990 |
11,940 events/s |
25,870 messages/s |
Types of graphs
The individual test results include four types of graphs:
Throughput |
Total throughput (calls per second) of a cluster over the course of the test run. The "ramp-up" period at the start of each run is required because the load generators are Java programs, which need time for the JVM to perform its compilation and optimisation of Java code. (If we did not use a ramp-up period, the load generators would be overloaded initially, which would skew the results.) |
|---|---|
Response Times |
Distribution of response-time changes during the course of the test run. |
Response Time Distribution |
Overall distribution of response times from the entire test run. |
CPU Utilization |
Percentage of CPU used on Rhino servers, as measured by |
Heap |
Heap usage. |


SIP 4 Node Results Using FT and 2 Domains on Java 8


SIP Benchmark Results Using HA
Summary
Benchmarks were performed for both Java 7 and Java 8, as rhino is currently certified on both versions.
Test procedure
-
All tests used TCP as the SIP transport.
-
Calls were evenly distributed between all available cluster nodes.
-
All calls had a duration of 60s.
-
Benchmarks were taken over a two-hour test run, including a JIT compiler warmup period for 20 minutes at 1500cps/node
Types of graphs
The individual test results include four types of graphs:
Throughput |
Total throughput (calls per second) of a cluster over the course of the test run. The "ramp-up" period at the start of each run is required because the load generators are Java programs, which need time for the JVM to perform its compilation and optimisation of Java code. (If we did not use a ramp-up period, the load generators would be overloaded initially, which would skew the results.) |
|---|---|
Response Times |
Distribution of response-time changes during the course of the test run. |
Response Time Distribution |
Overall distribution of response times from the entire test run. |
CPU Utilization |
Percentage of CPU used on Rhino servers, as measured by |
Heap |
Heap usage. |
SIP Benchmark Results Using HA on Java 7
Below is a summary of the Java 7 results.
Summary
| Cluster size | Call Rate | Event Rate | SIP message Rate | Results |
|---|---|---|---|---|
|
One node |
2100 |
12,600 events/s |
27,300 messages/s |
|
|
Two nodes |
4199 |
25,194 events/s |
54,587 messages/s |
|
|
Three nodes |
6298 |
37,788 events/s |
81,874 messages/s |
|
|
Four nodes |
8397 |
50,382 events/s |
109,161 messages/s |
Types of graphs
The individual test results include four types of graphs:
Throughput |
Total throughput (calls per second) of a cluster over the course of the test run. The "ramp-up" period at the start of each run is required because the load generators are Java programs, which need time for the JVM to perform its compilation and optimisation of Java code. (If we did not use a ramp-up period, the load generators would be overloaded initially, which would skew the results.) |
|---|---|
Response Times |
Distribution of response-time changes during the course of the test run. |
Response Time Distribution |
Overall distribution of response times from the entire test run. |
CPU Utilization |
Percentage of CPU used on Rhino servers, as measured by |
Heap |
Heap usage. |


SIP 4 Node Results Using HA on Java 7


SIP Benchmark Results Using HA on Java 8
Below is a summary of the Java 8 results.
Summary
| Cluster size | Call Rate | Event Rate | SIP message Rate | Results |
|---|---|---|---|---|
|
One node |
2100 |
12,600 events/s |
27,300 messages/s |
|
|
Two nodes |
4199 |
25,194 events/s |
54,587 messages/s |
|
|
Three nodes |
6298 |
37,788 events/s |
81,874 messages/s |
|
|
Four nodes |
8397 |
50,382 events/s |
109,161 messages/s |
Types of graphs
The individual test results include four types of graphs:
Throughput |
Total throughput (calls per second) of a cluster over the course of the test run. The "ramp-up" period at the start of each run is required because the load generators are Java programs, which need time for the JVM to perform its compilation and optimisation of Java code. (If we did not use a ramp-up period, the load generators would be overloaded initially, which would skew the results.) |
|---|---|
Response Times |
Distribution of response-time changes during the course of the test run. |
Response Time Distribution |
Overall distribution of response times from the entire test run. |
CPU Utilization |
Percentage of CPU used on Rhino servers, as measured by |
Heap |
Heap usage. |