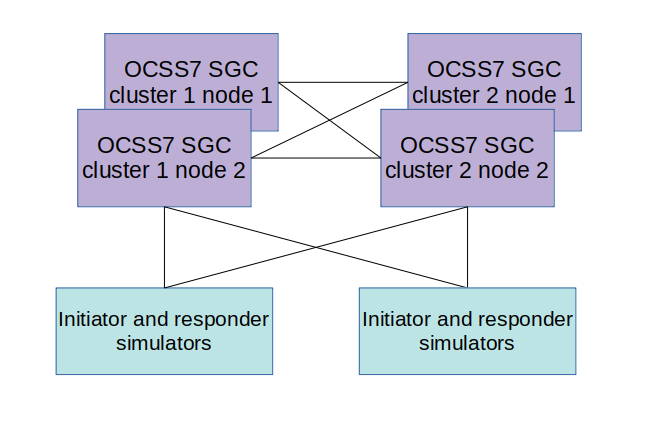
This book contains performance benchmarks using Metaswitch’s OCSS7.
It contains these sections:
-
Benchmark Scenarios — descriptions of each of the benchmark scenarios, and notes on the benchmark methodology used.
-
Hardware and Software — details of the hardware, software, and configuration used for the benchmarks.
-
Benchmark Results — summaries of the benchmarks and links to detailed metrics.
Other documentation for OCSS7 can be found on the OCSS7 product page.
Benchmark Scenarios
This page describes the scenarios and methodology used when running the benchmarks.
Benchmarks are run using two scenarios: CAP and MAP.
CAP call monitoring scenario
These scenarios consist of dialogs following the message flow:
-
The initiator sends a TC-BEGIN initiating a CAP v2 dialog, containing an CAP InitialDP operation invoke
-
The responder sends a TC-CONTINUE containing two operation invokes: CAP RequestReportBCSM(oAnswer,oDisconnect), and CAP Continue
-
The initiator delays for 10 seconds
-
The initiator sends a TC-CONTINUE containing a CAP EventReportBCSM(oAnswer) operation invoke
-
The initiator delays for 60 seconds
-
The initiator sends a TC-CONTINUE containing a CAP EventReportBCSM(oDisconnect) operation invoke
-
The dialog is ended with prearranged end on both the initiator and responder
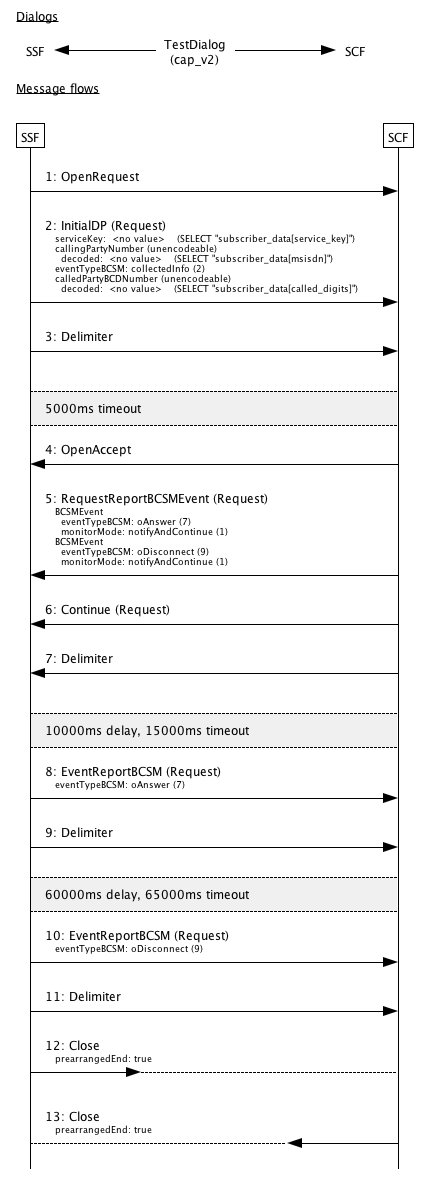
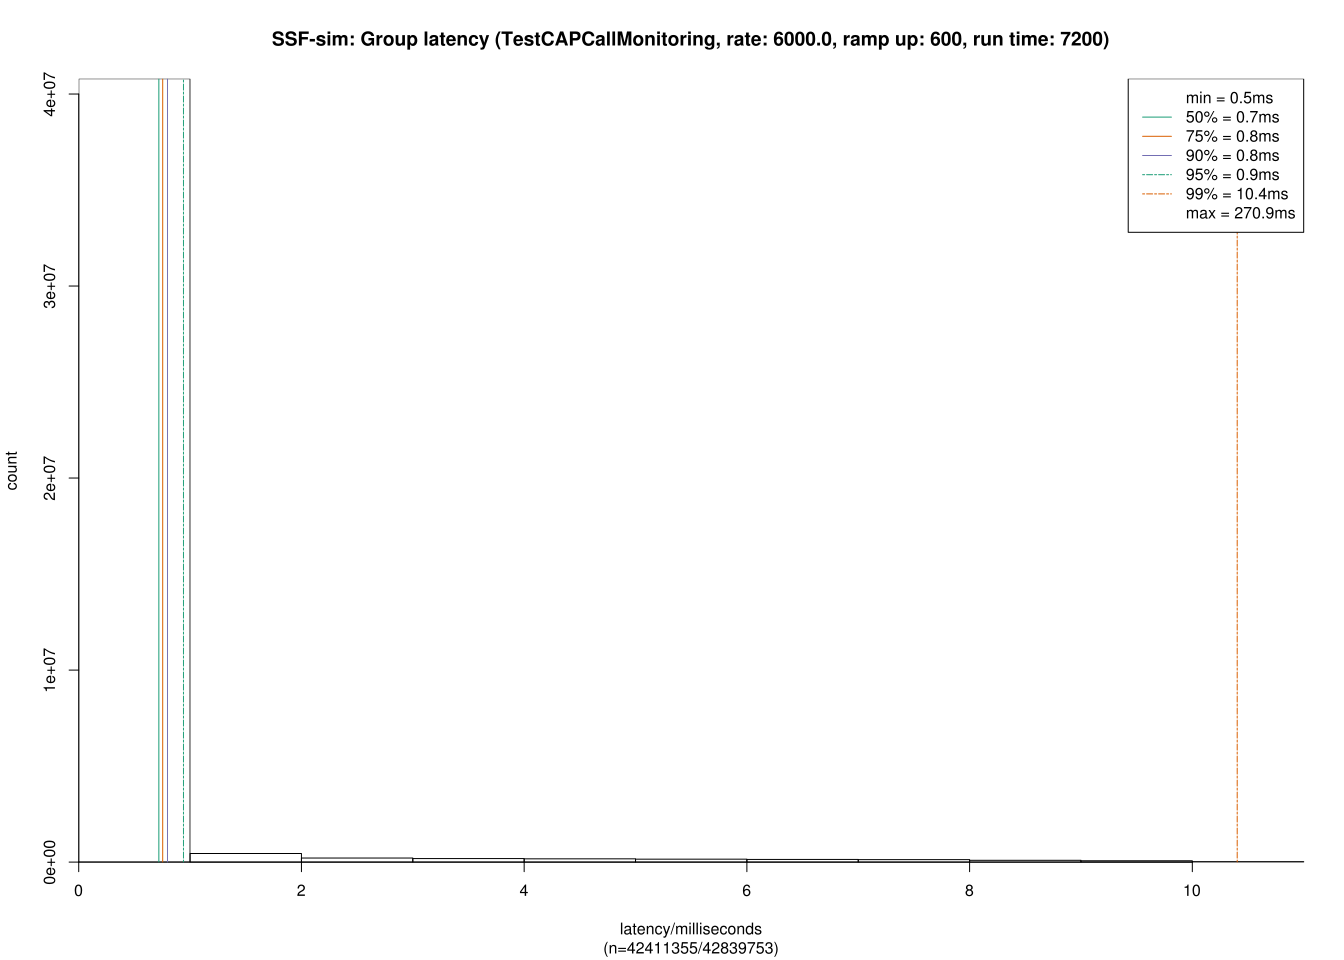
Response time is measured on the test system by the scenario simulator infrastructure, from immediately before submission of the InitialDP to the TCAP stack, to immediately after receipt of the TC-CONTINUE containing the CAP Continue invoke from the TCAP stack.
MAP SRI for SM scenario
These scenarios consist of dialogs following the message flow:
-
The initiator sends a TC-BEGIN initiating a MAP dialog, containing SEND-ROUTING- INFO-FOR-SM invoke
-
The responder immediately responds with a TC-END containing a SEND-ROUTING- INFO-FOR-SM result
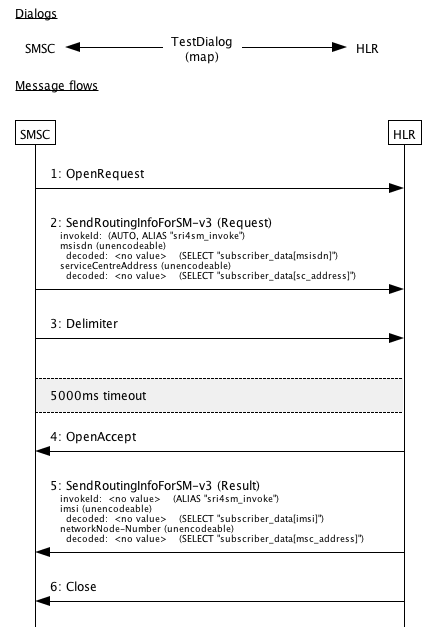
Response time is measured on the test system by the scenario simulator infrastructure, from immediately before submission of the SendRoutingInfoForSM(Request) to the TCAP stack, to immediately after receipt of the SendRoutingInfoForSM(Result) from the TCAP stack.
Test setup
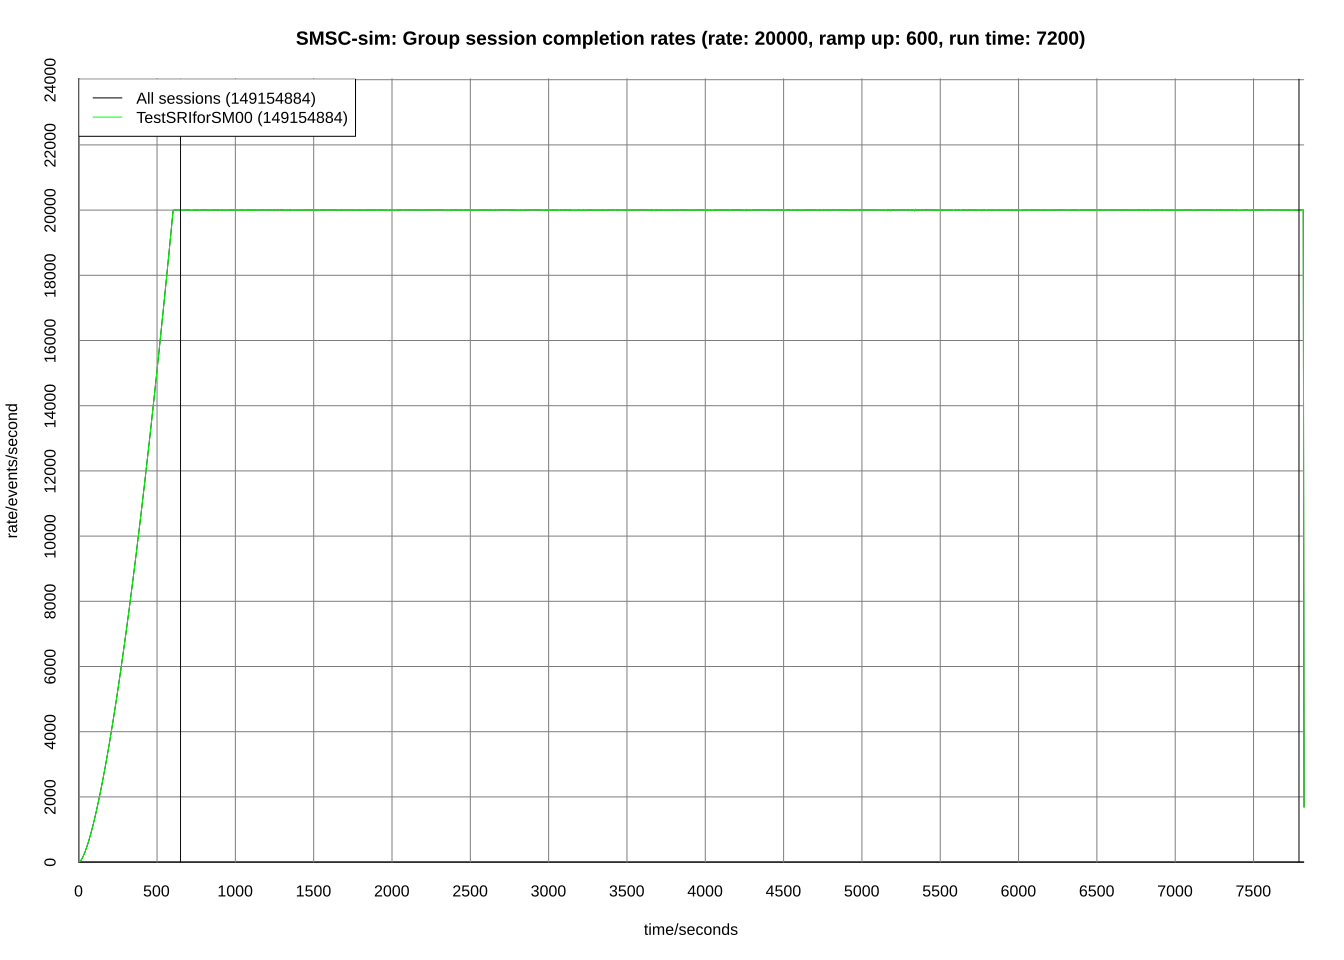
Each test run consists of a 10 minute ramp-up period where load is increased from zero to the target rate; then a 2 hour measurement period at peak load; then a 2 minute drain period during which no new dialogs are initiated.
The ramp-up period is included as the Oracle JVM provides a Just In Time (JIT) compiler. The JIT compiler compiles Java bytecode to machinecode, and recompiles code on the fly to take advantage of optimizations not otherwise possible. This dynamic compilation and optimization process takes some time to complete. During the early stages of JIT compilation/optimization, the node cannot process full load. JVM garbage collection does not reach full efficiency until several major garbage collection cycles have completed.
Only latency measurements during the measurement period are used; latency measurements during the ramp-up period are ignored.
Load is not stopped between ramp up and starting the test timer.
Hardware and Software
This page describes the hardware and software used when running the benchmarks.
Hardware
| EC2 Instance Type | Number Of Instances | EC2 Optimisation | Specs | OS |
|---|---|---|---|---|
c5d.2xlarge |
4 |
compute |
CPU: 8 Cores, RAM: 16 Gb, Attached storage: SSD 200 Gb |
CentOS 7.6 1810 (Core) |
c5d.4xlarge |
2 |
compute |
CPU: 8 Cores, RAM: 32 Gb, Attached storage: SSD 2x200 Gb |
CentOS 7.6 1810 (Core) |
Software
| Vendor | Software | Version |
|---|---|---|
Oracle |
JDK 11 (64 bit) |
|
Metaswitch |
3.0.0.0 |
|
Metaswitch |
2.3.0.8 |
|
Metaswitch |
2.0.0.0 |
Configuration
| Parameter | Value |
|---|---|
Heap size |
1024M |
com.cts.ss7.commsp.server.sendQueueCapacity |
1024 |
sgc.ind.pool_size |
10000 |
sgc.req.pool_size |
10000 |
sgc.worker.threads |
32 |
| Parameter | Value |
|---|---|
net.sctp.rto_min |
80 |
net.sctp.sack_timeout |
70 |
net.core.rmem_max |
2048000 |
net.core.wmem_max |
2048000 |
Benchmark Results
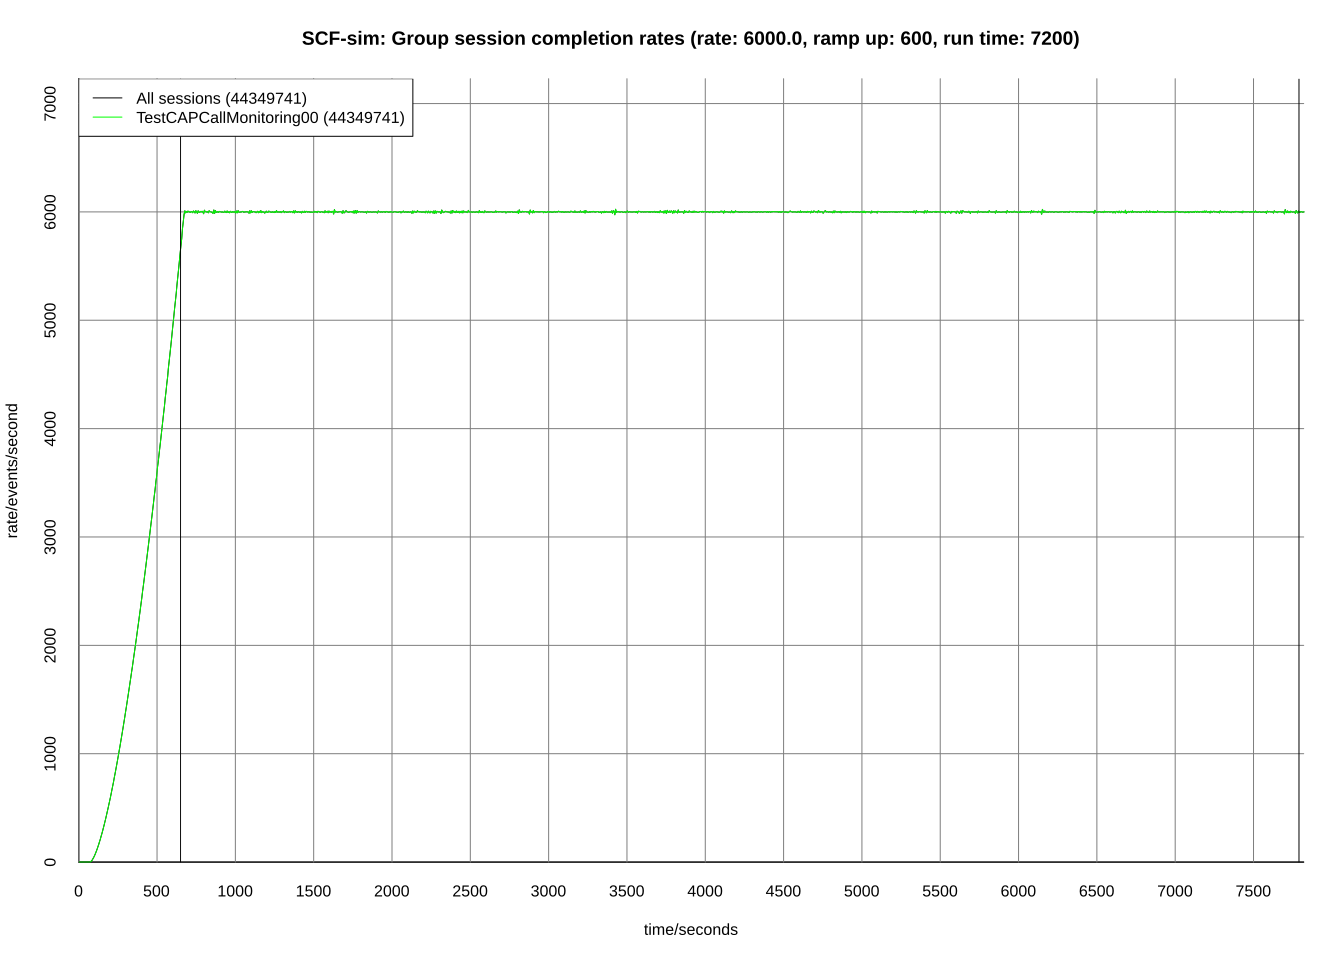
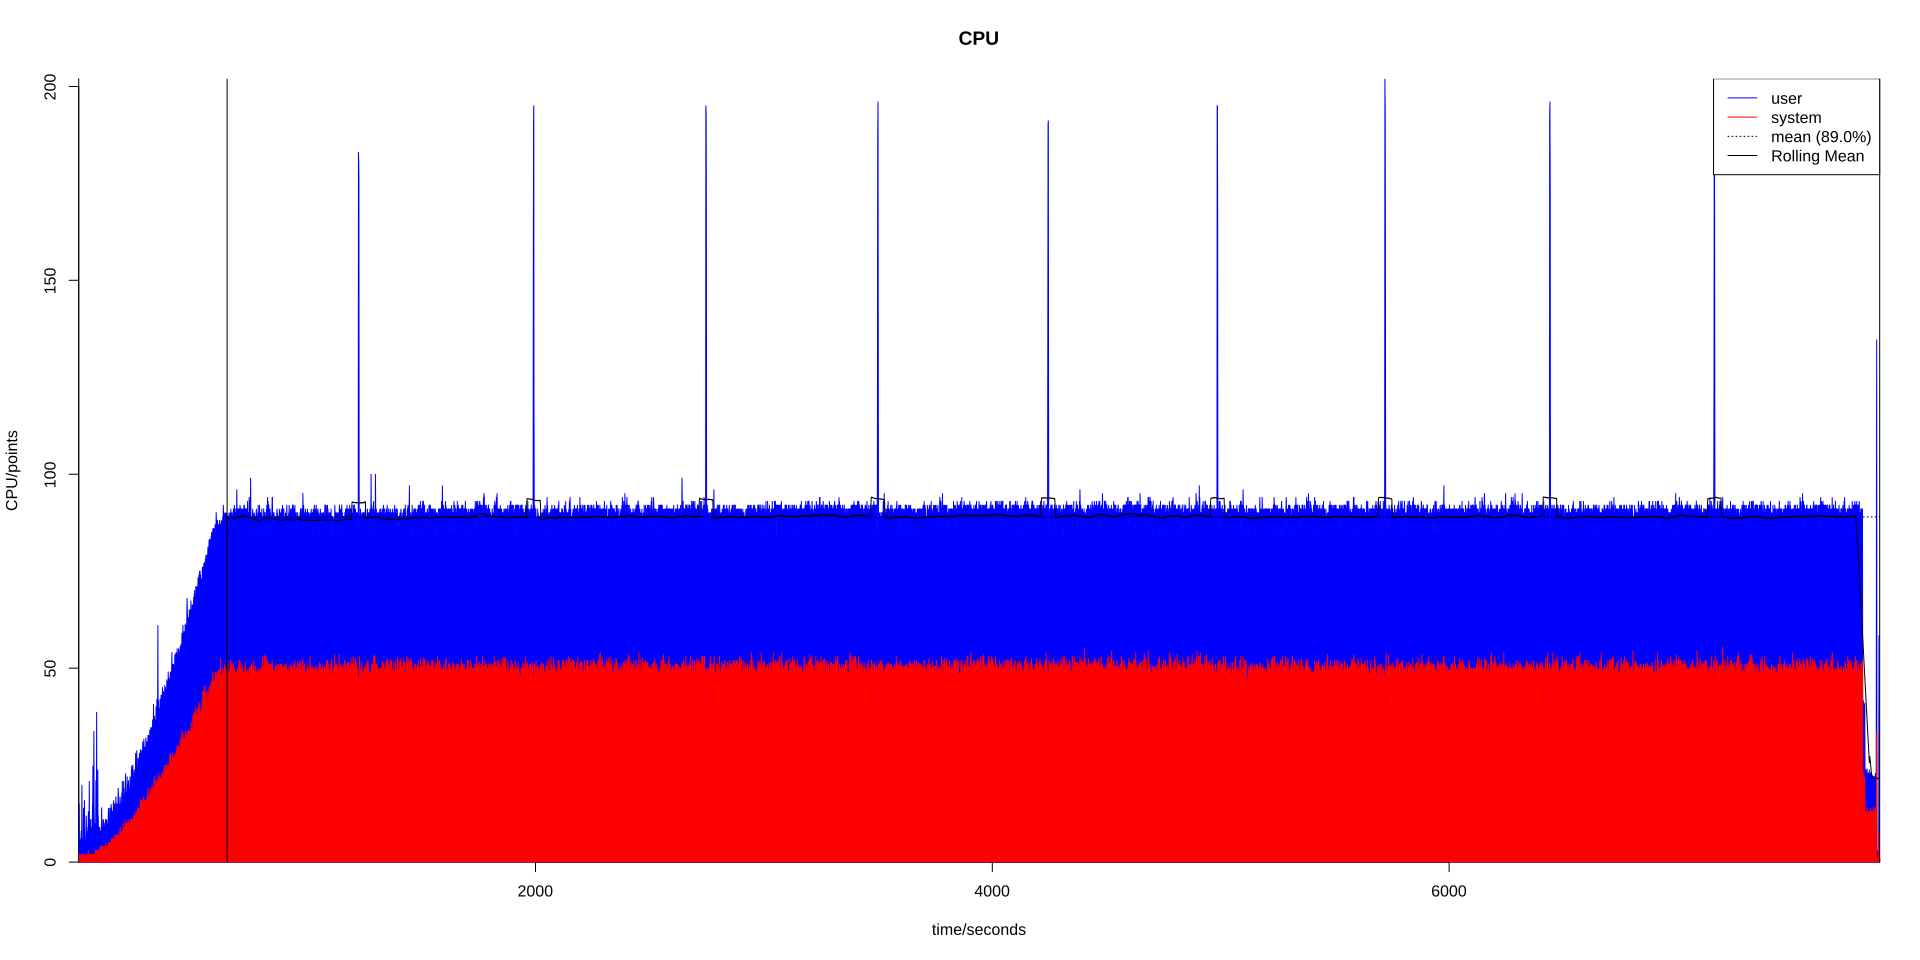
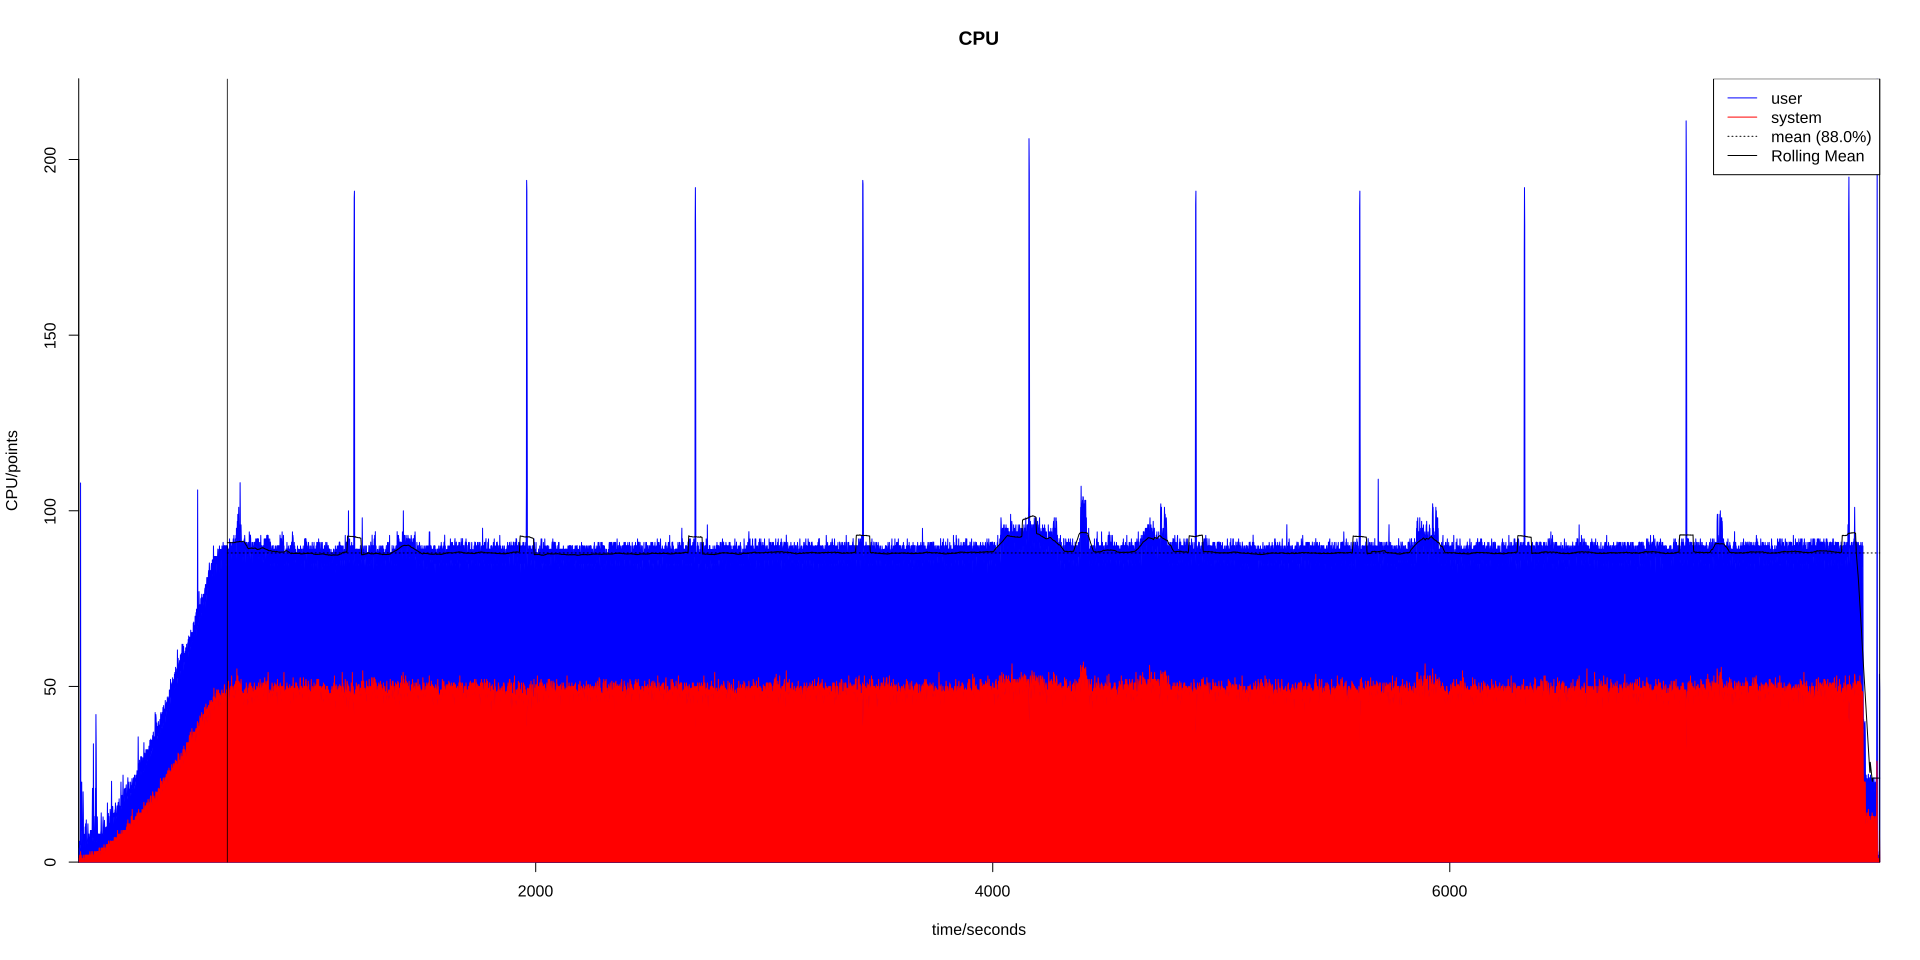
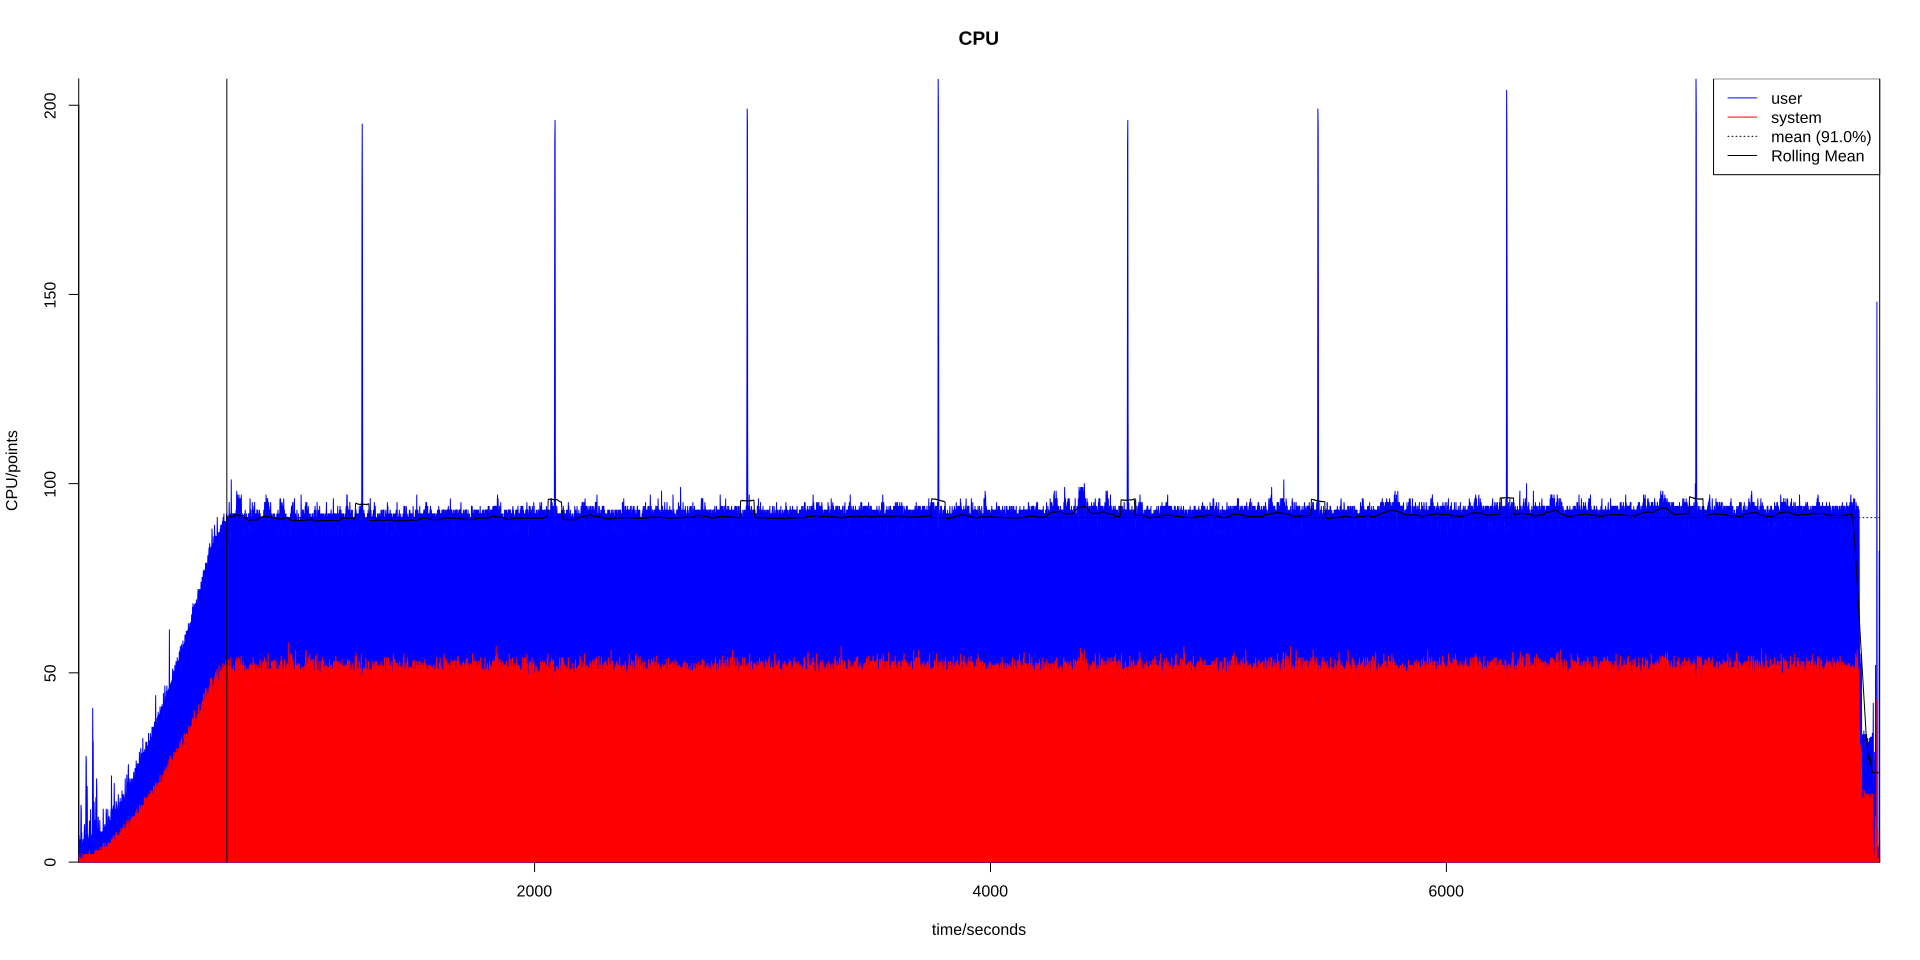
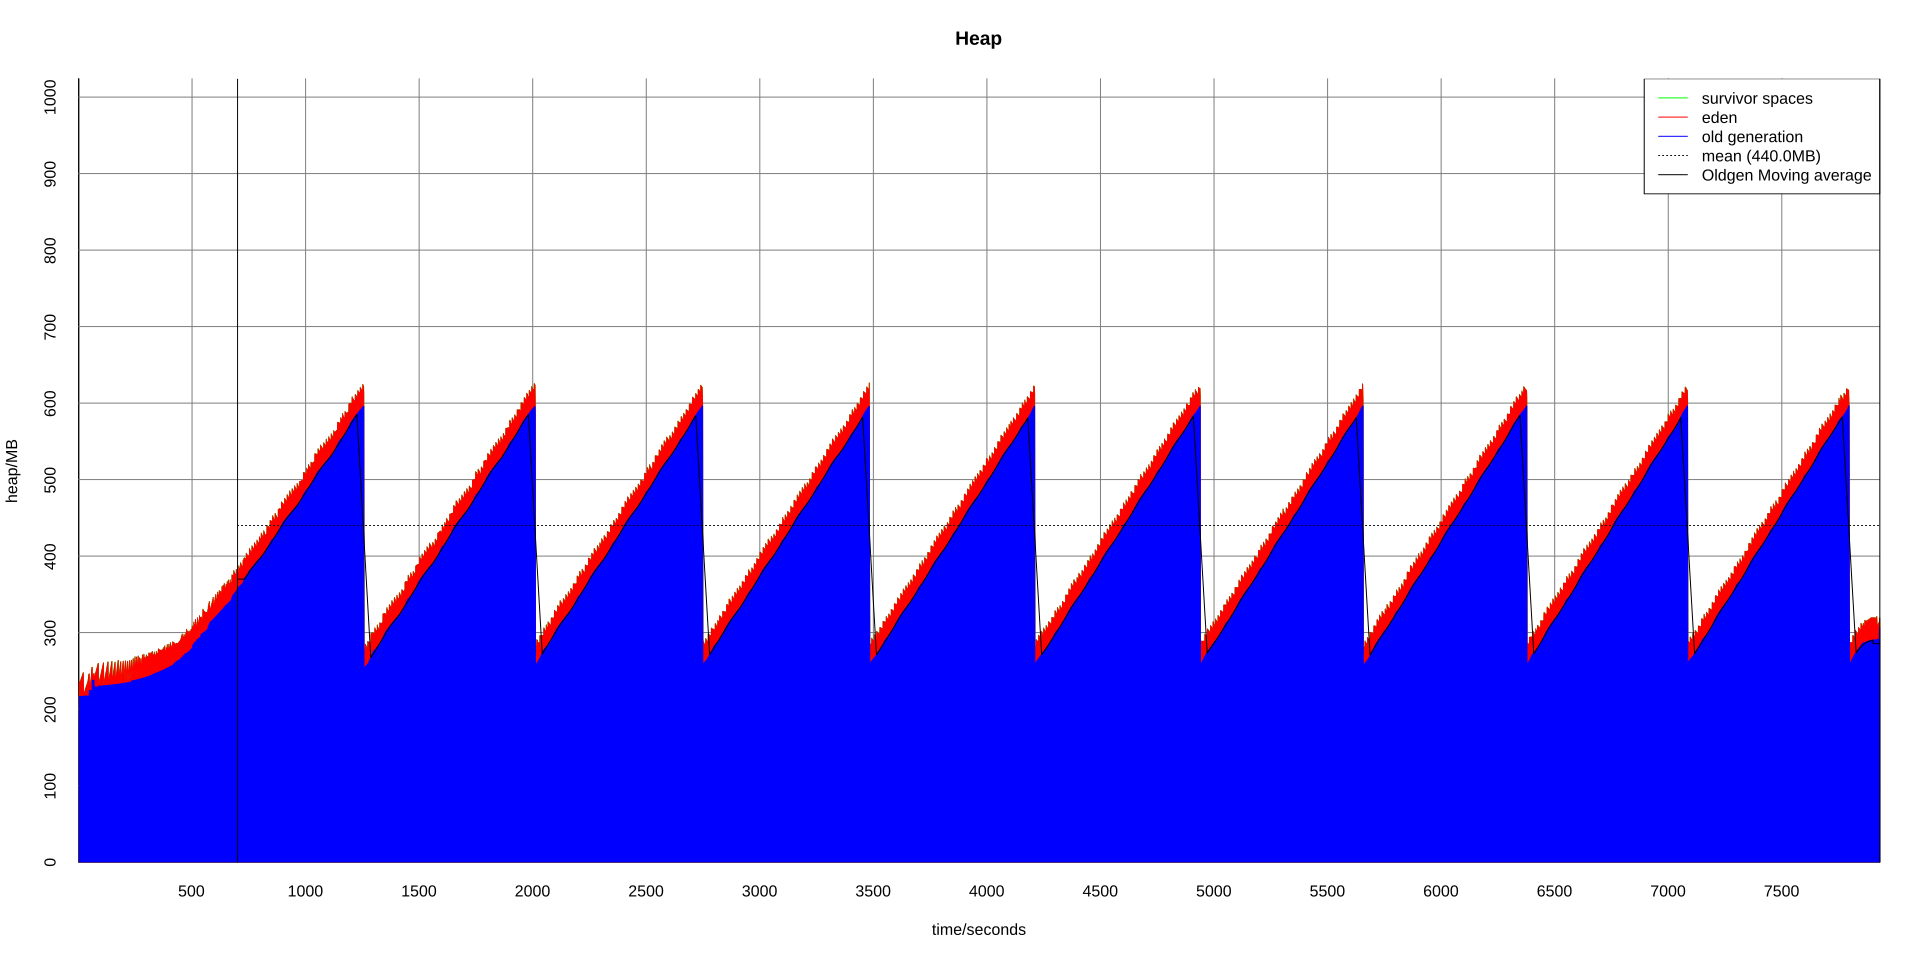
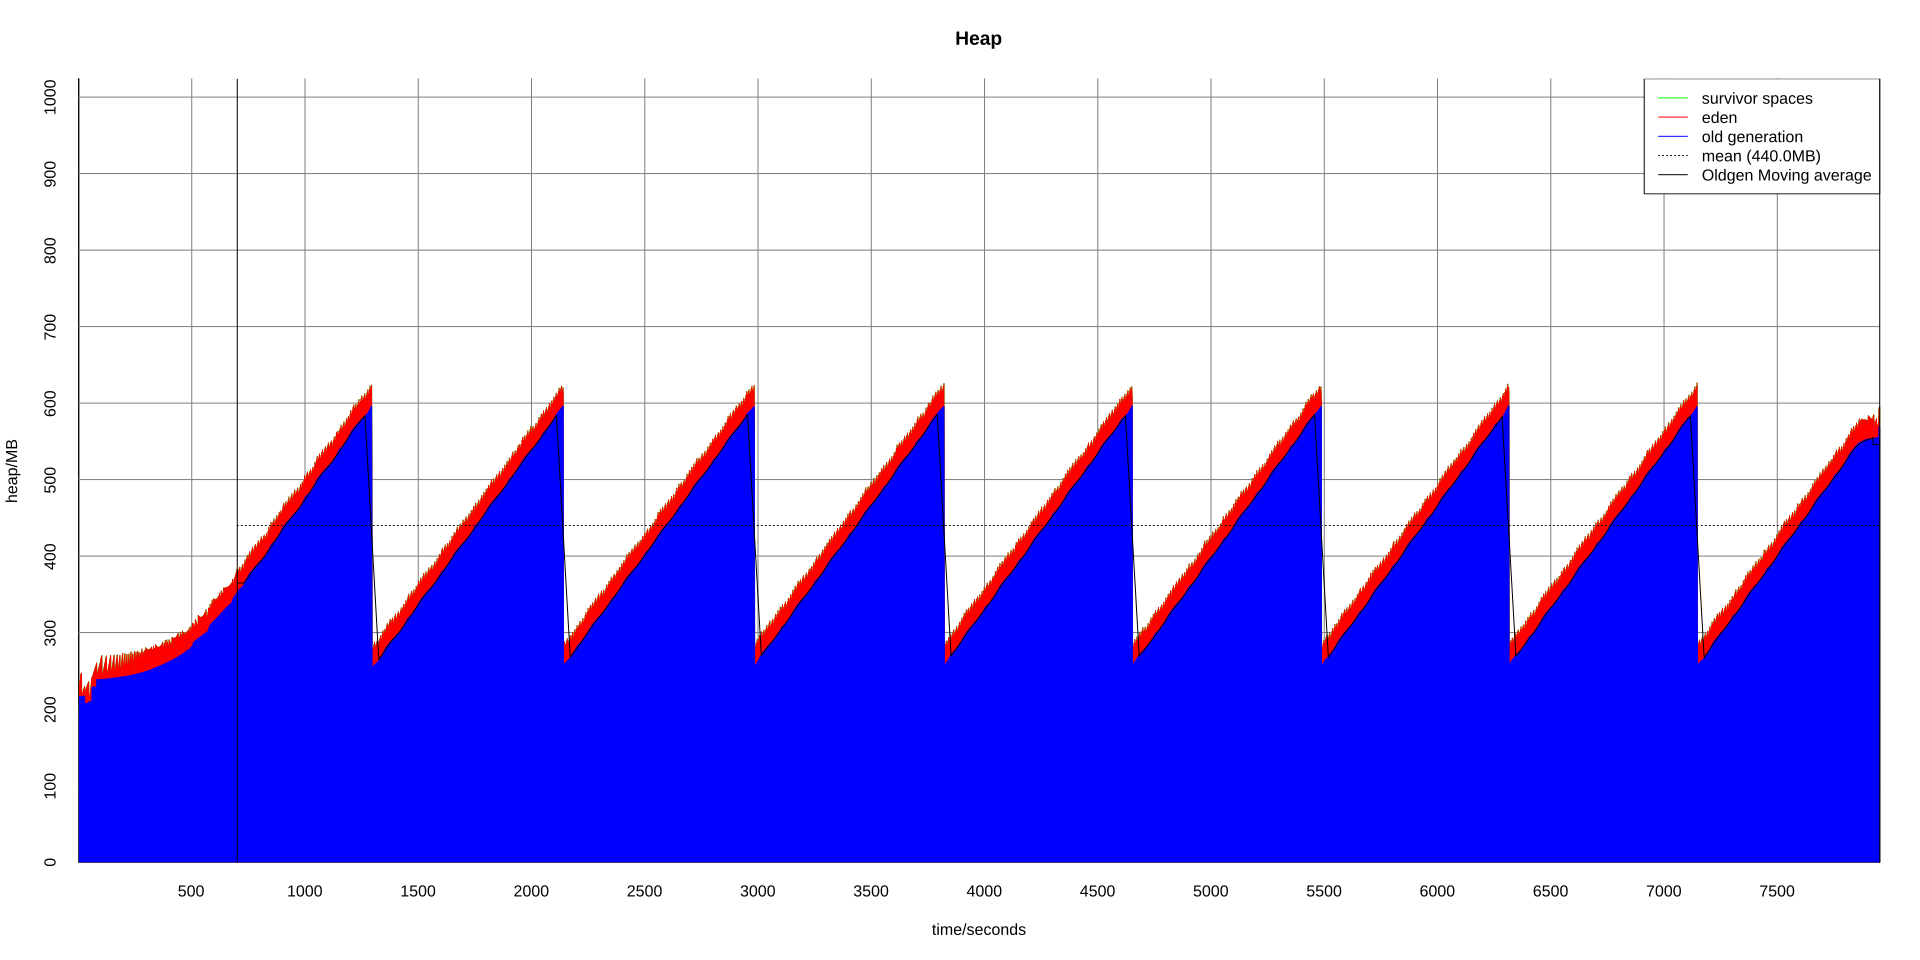
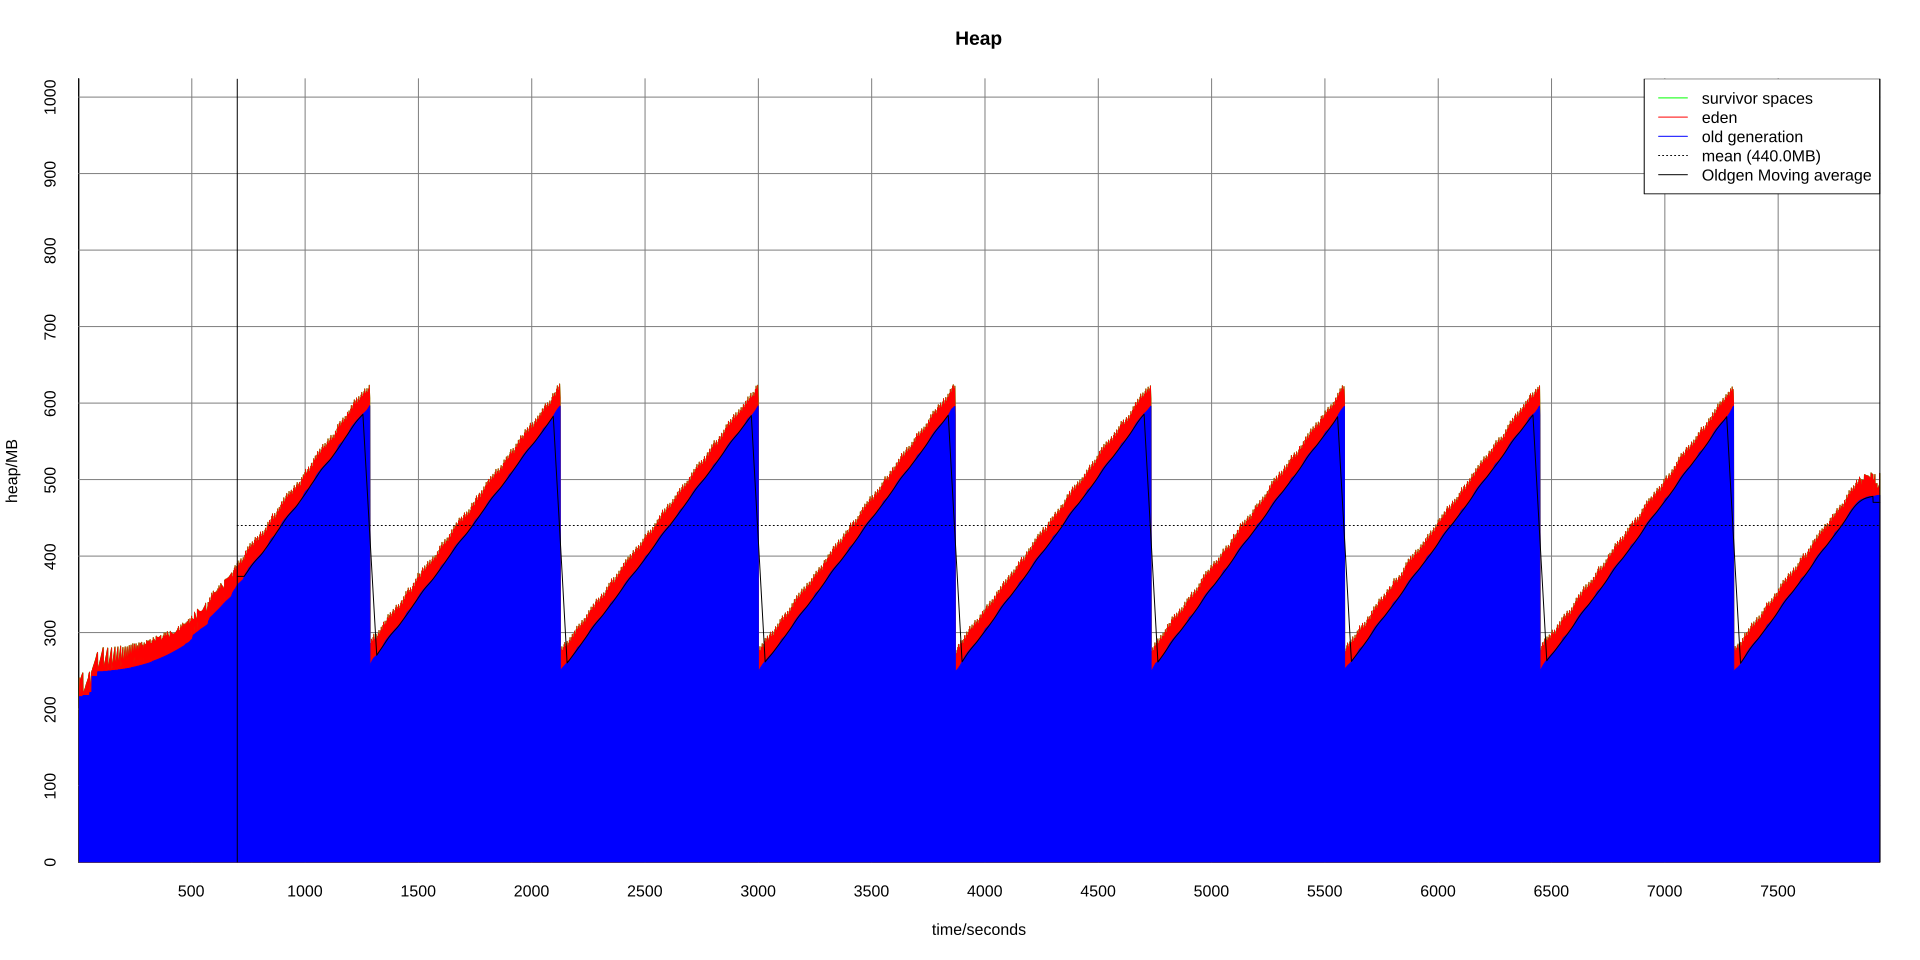
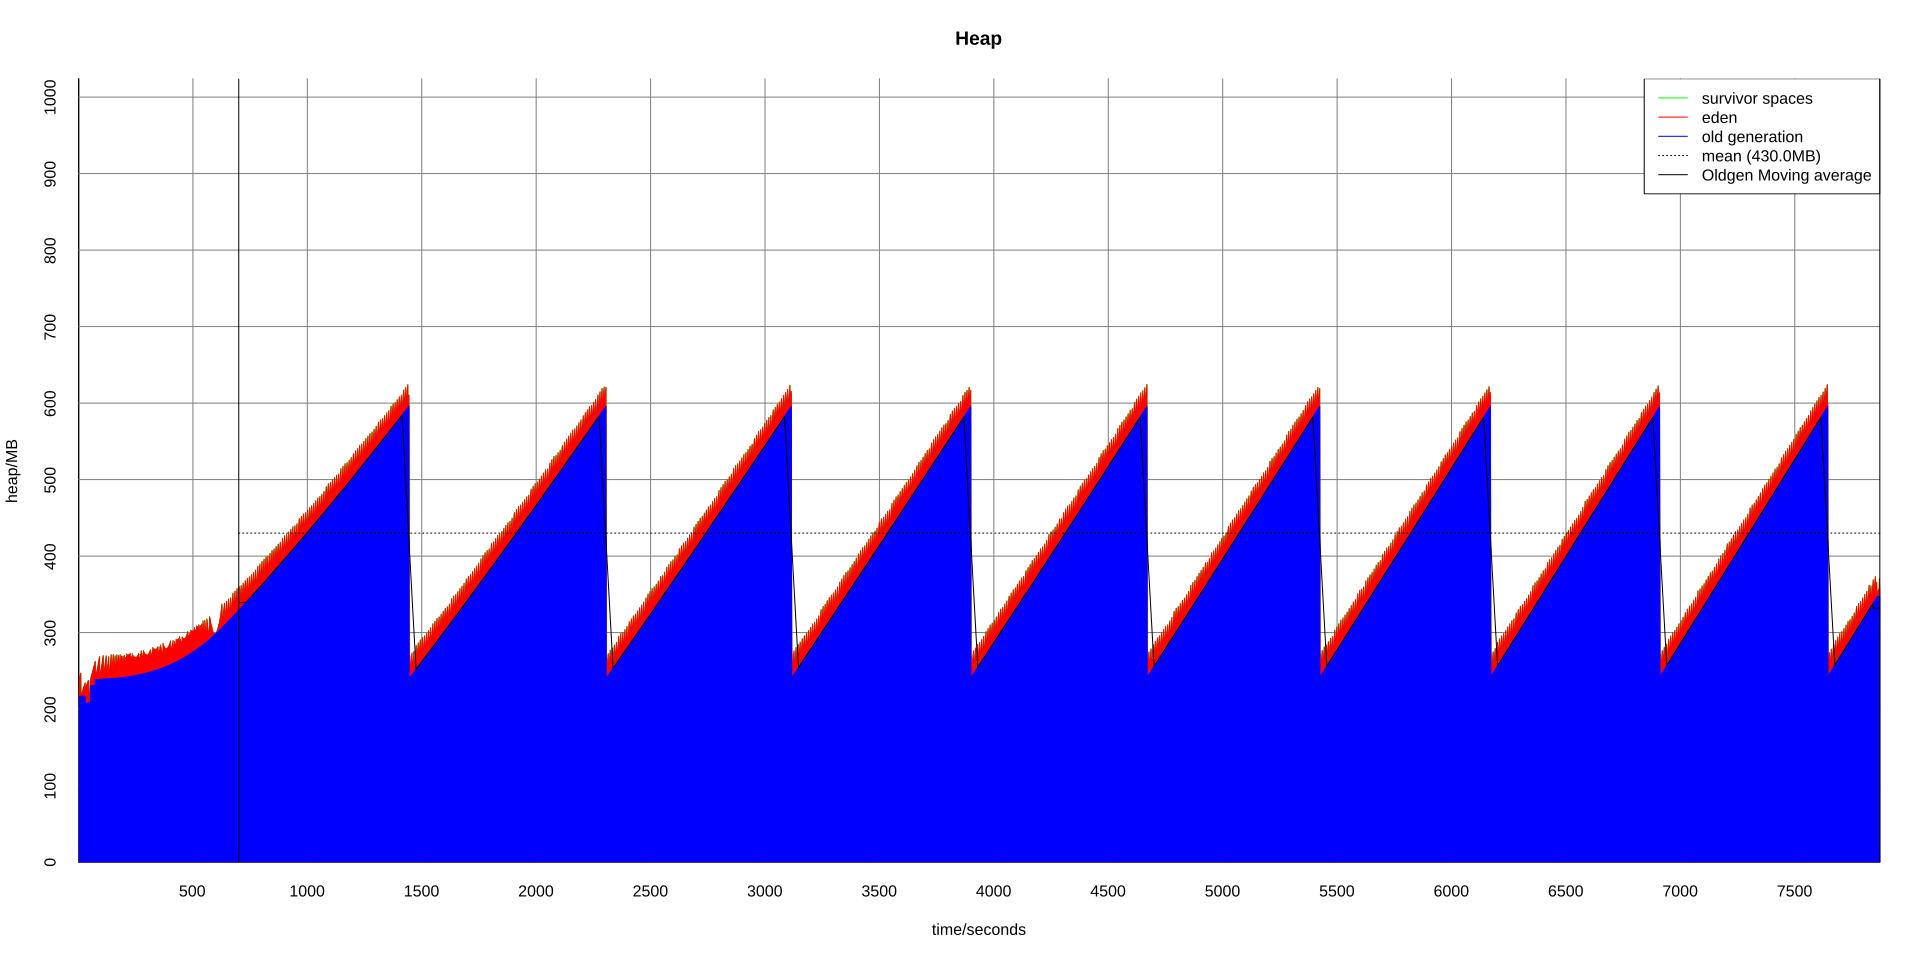
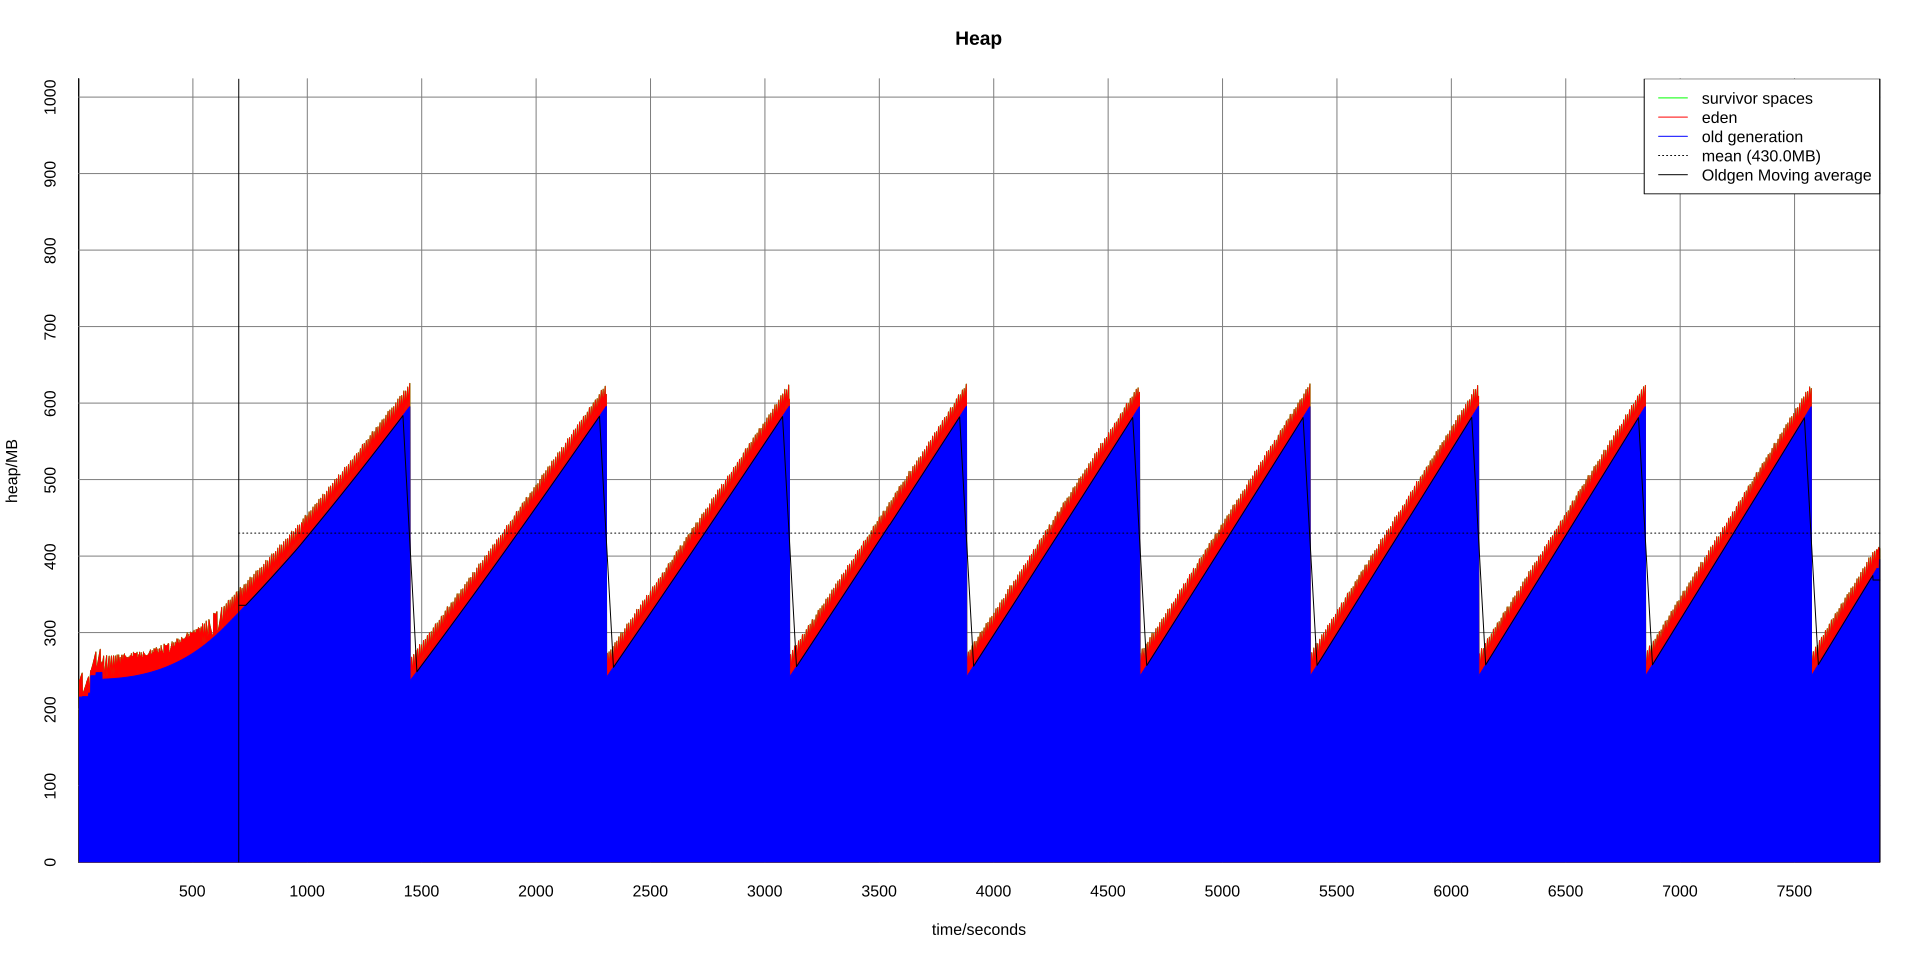
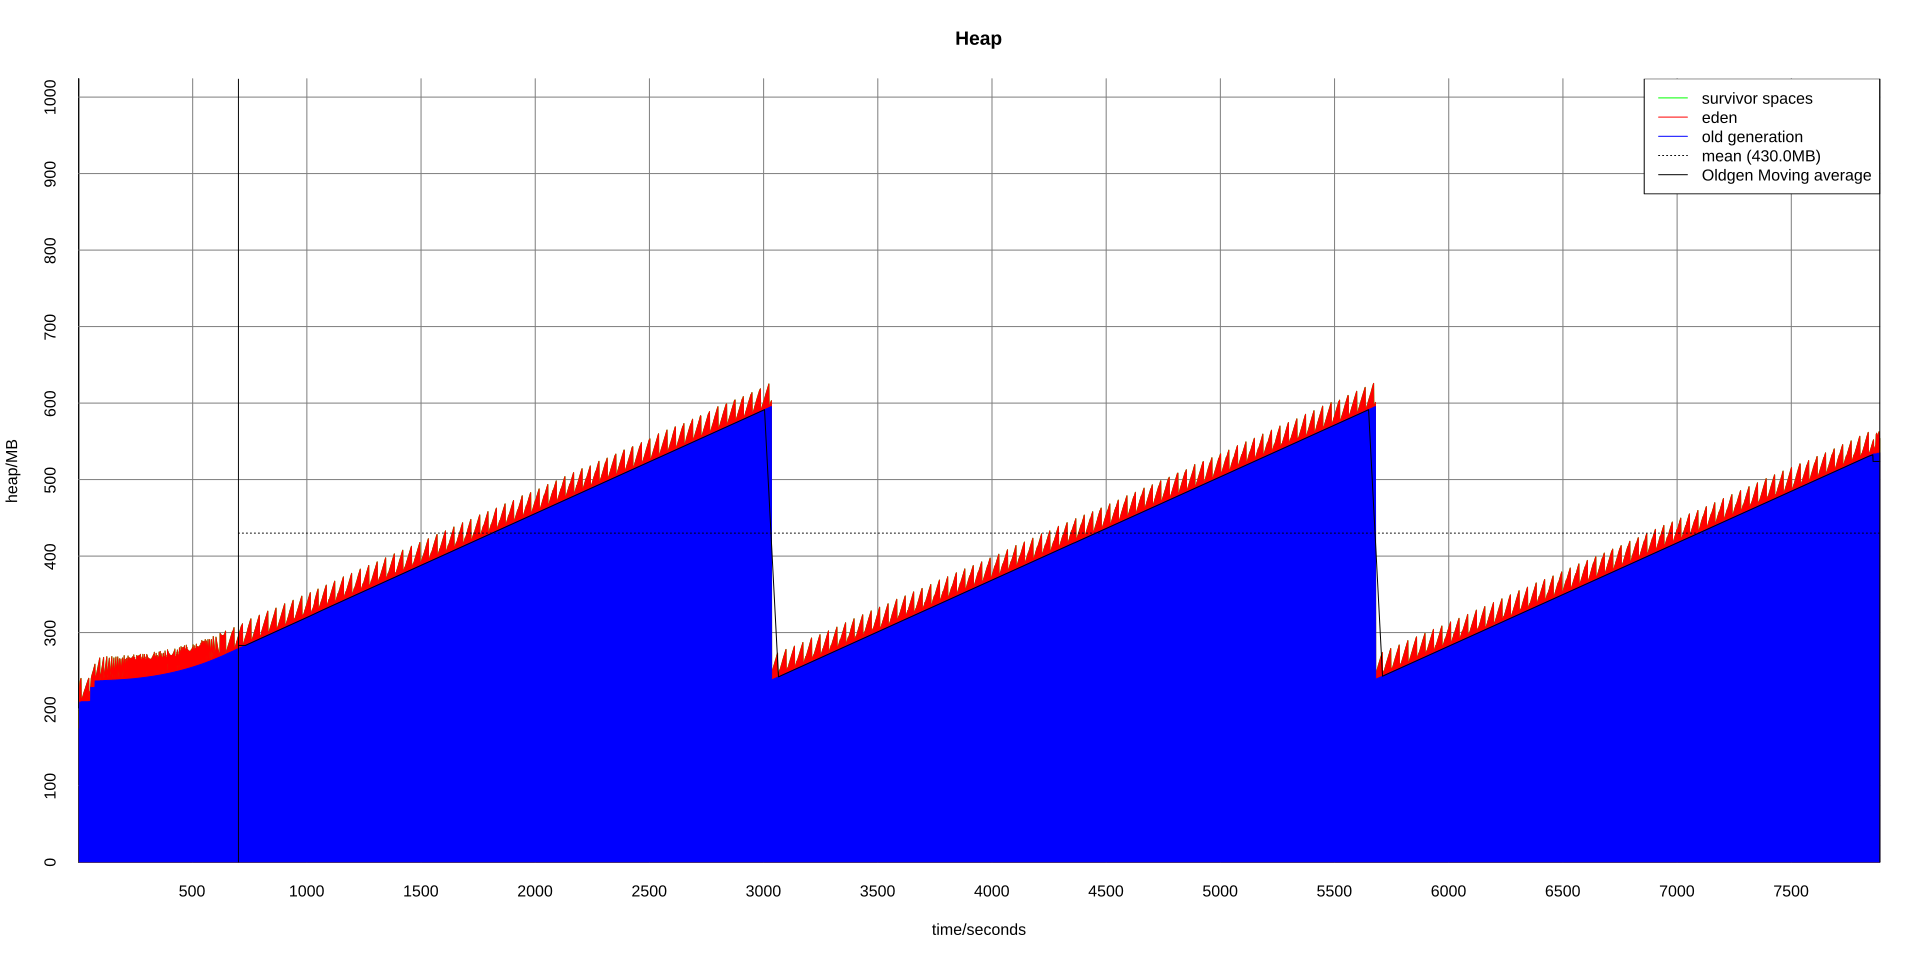
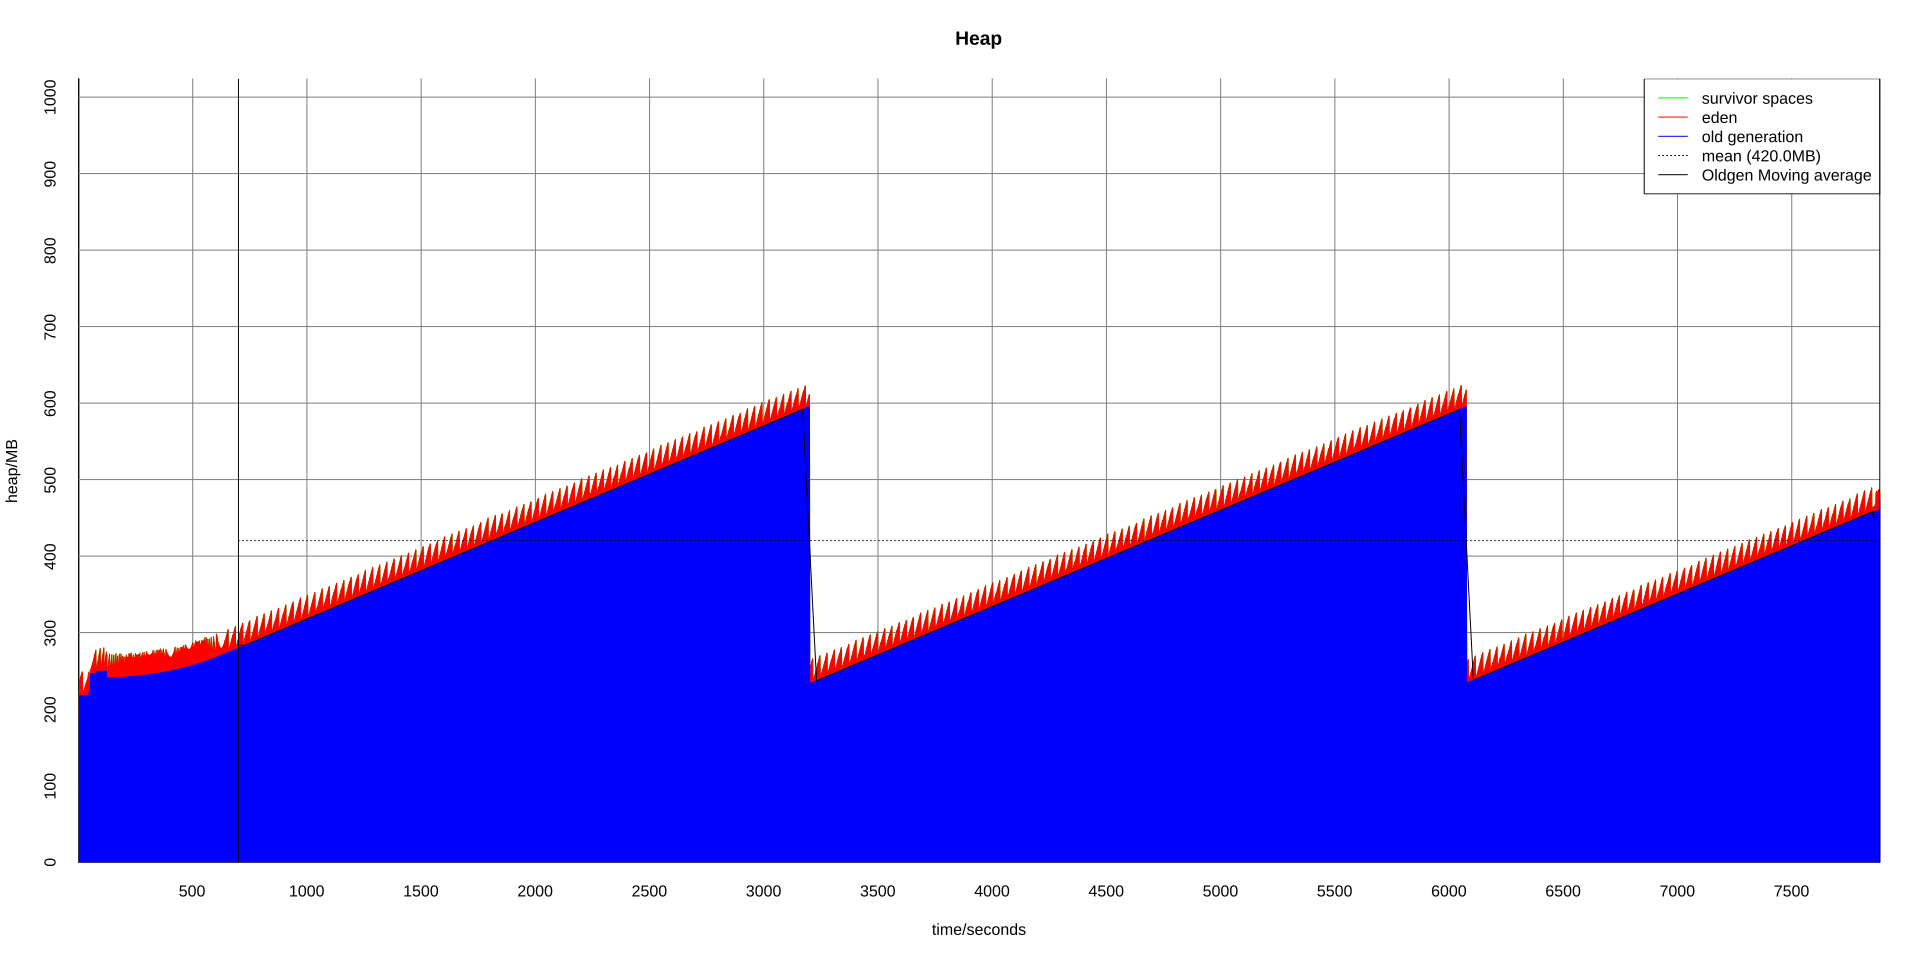
A summary of the benchmark results follows. Click on a benchmark name for detailed results.
| Benchmark | Rate | CPU Usage | ||||||||||
|---|---|---|---|---|---|---|---|---|---|---|---|---|
|
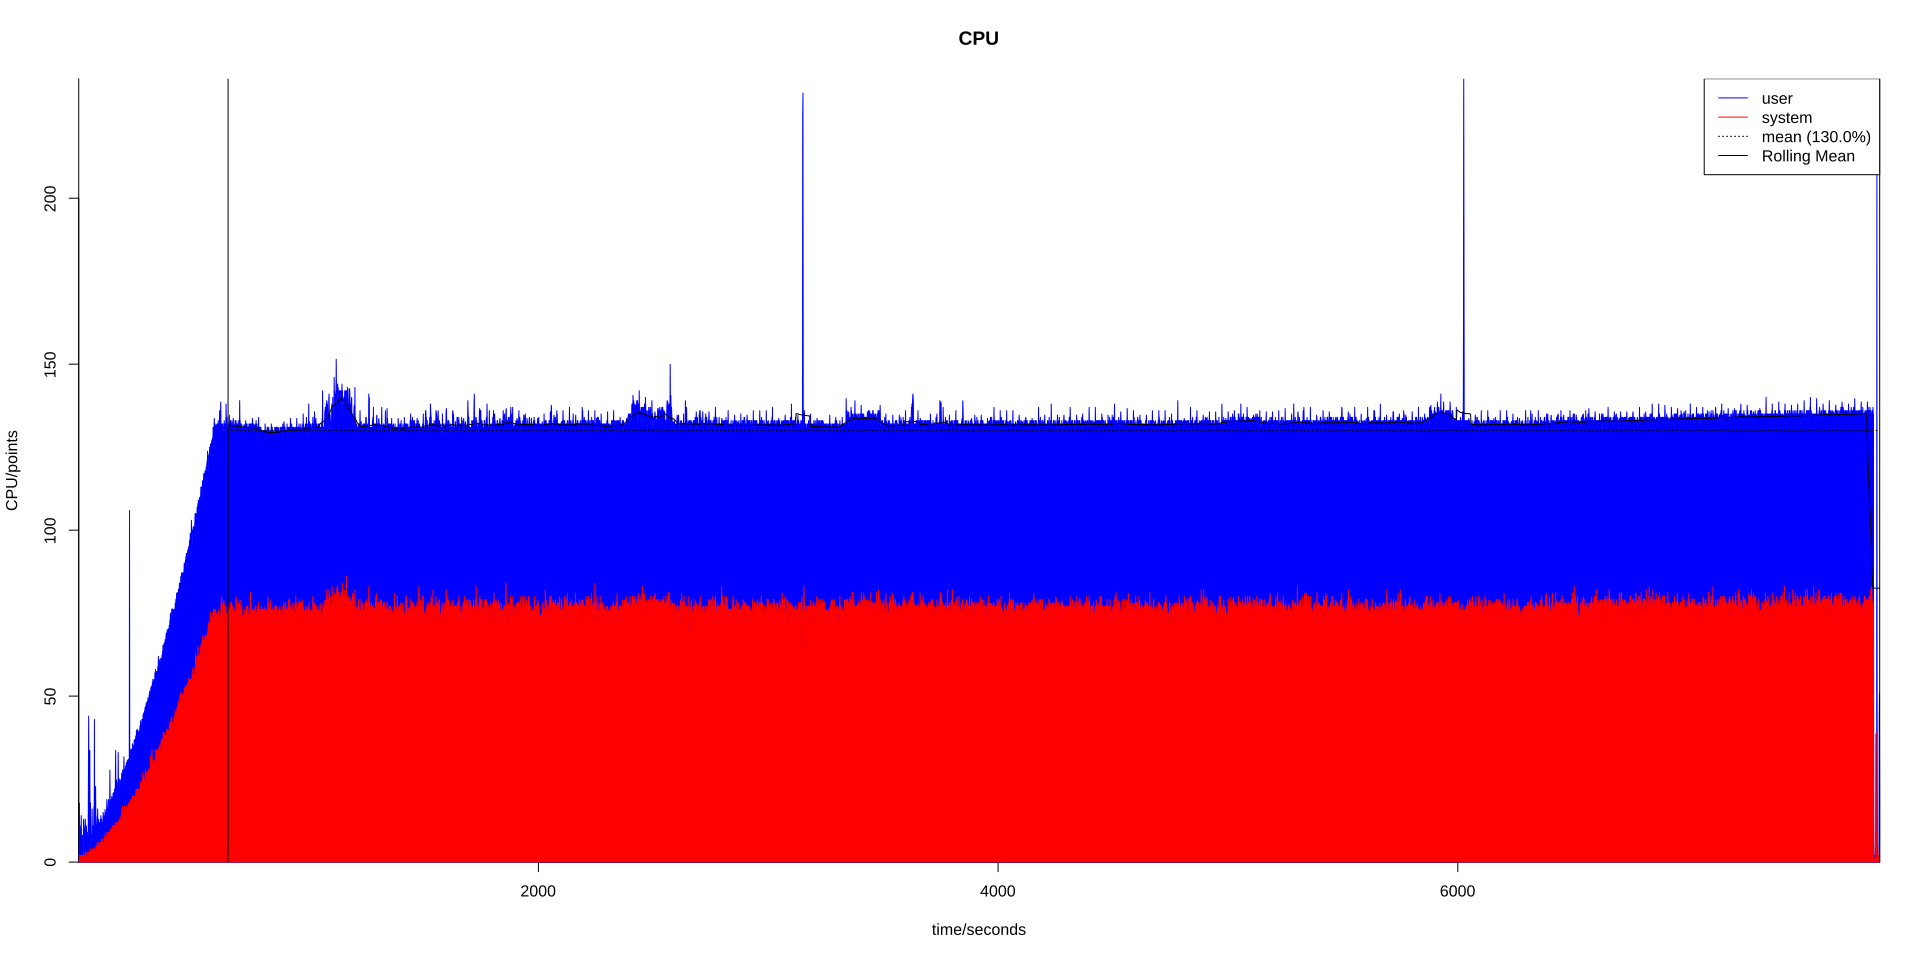
6000 calls per second (24000 messages per second) |
|
|||||||||||
|
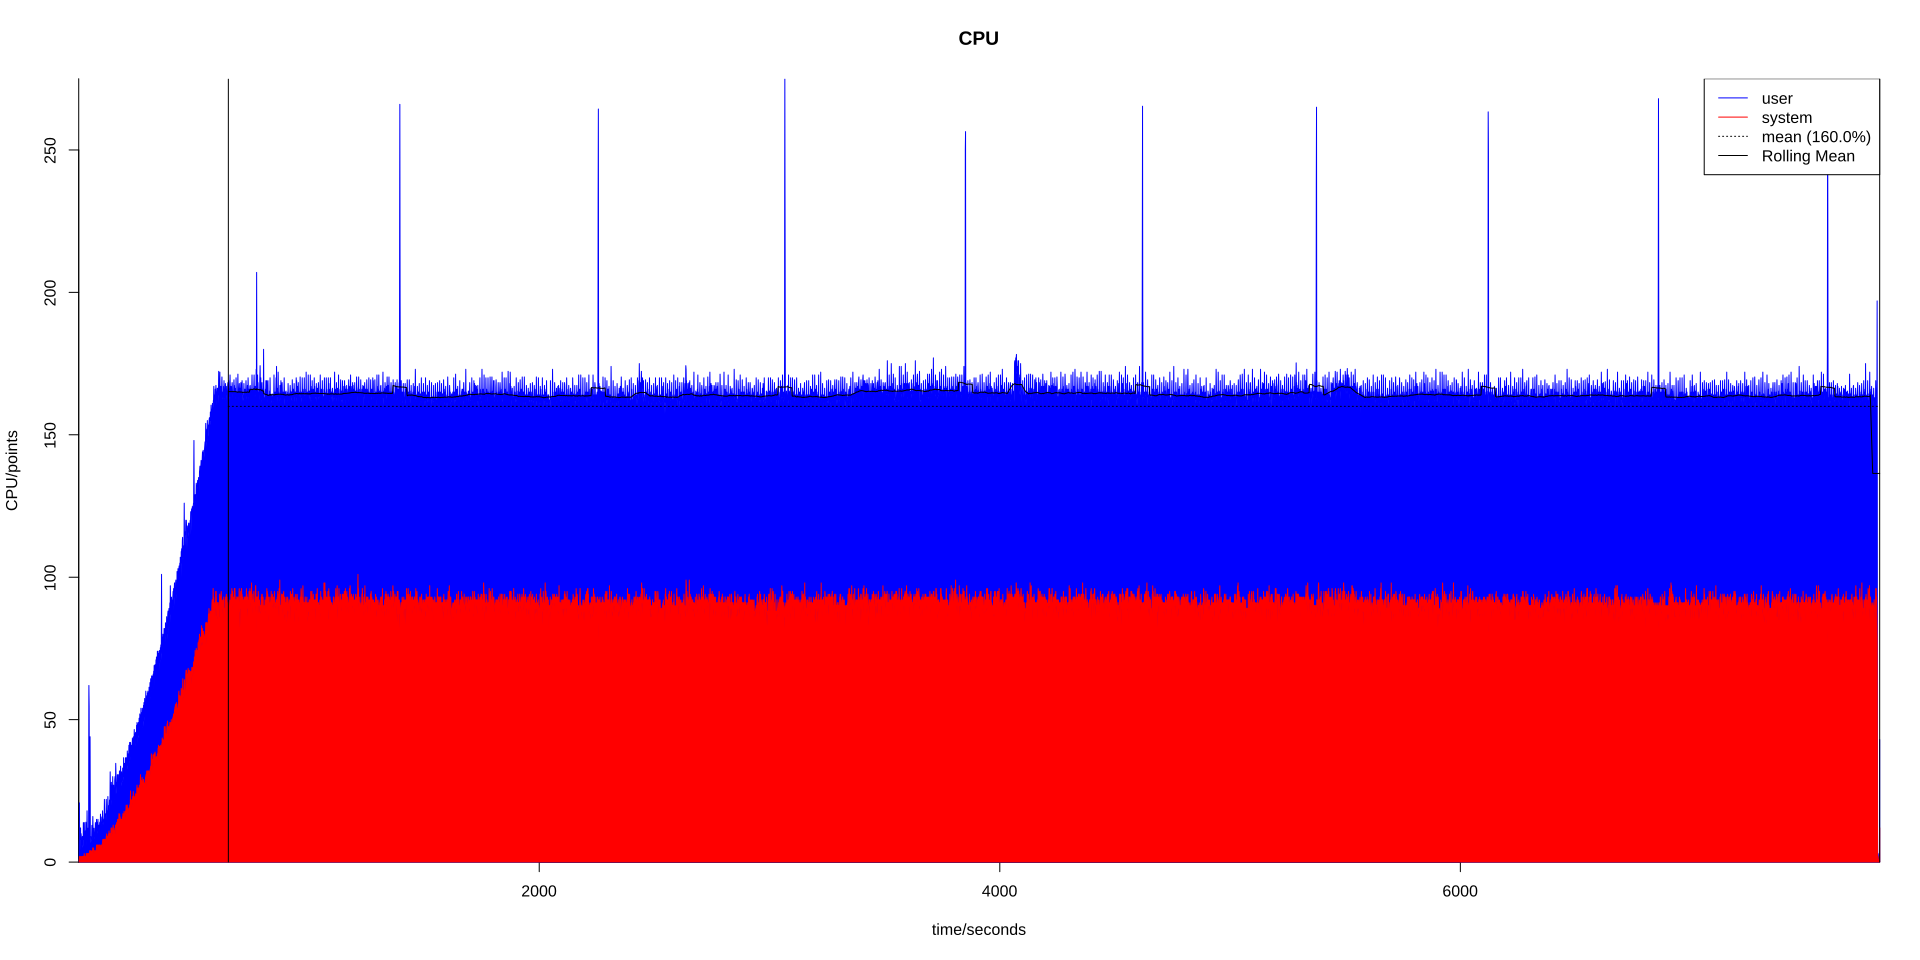
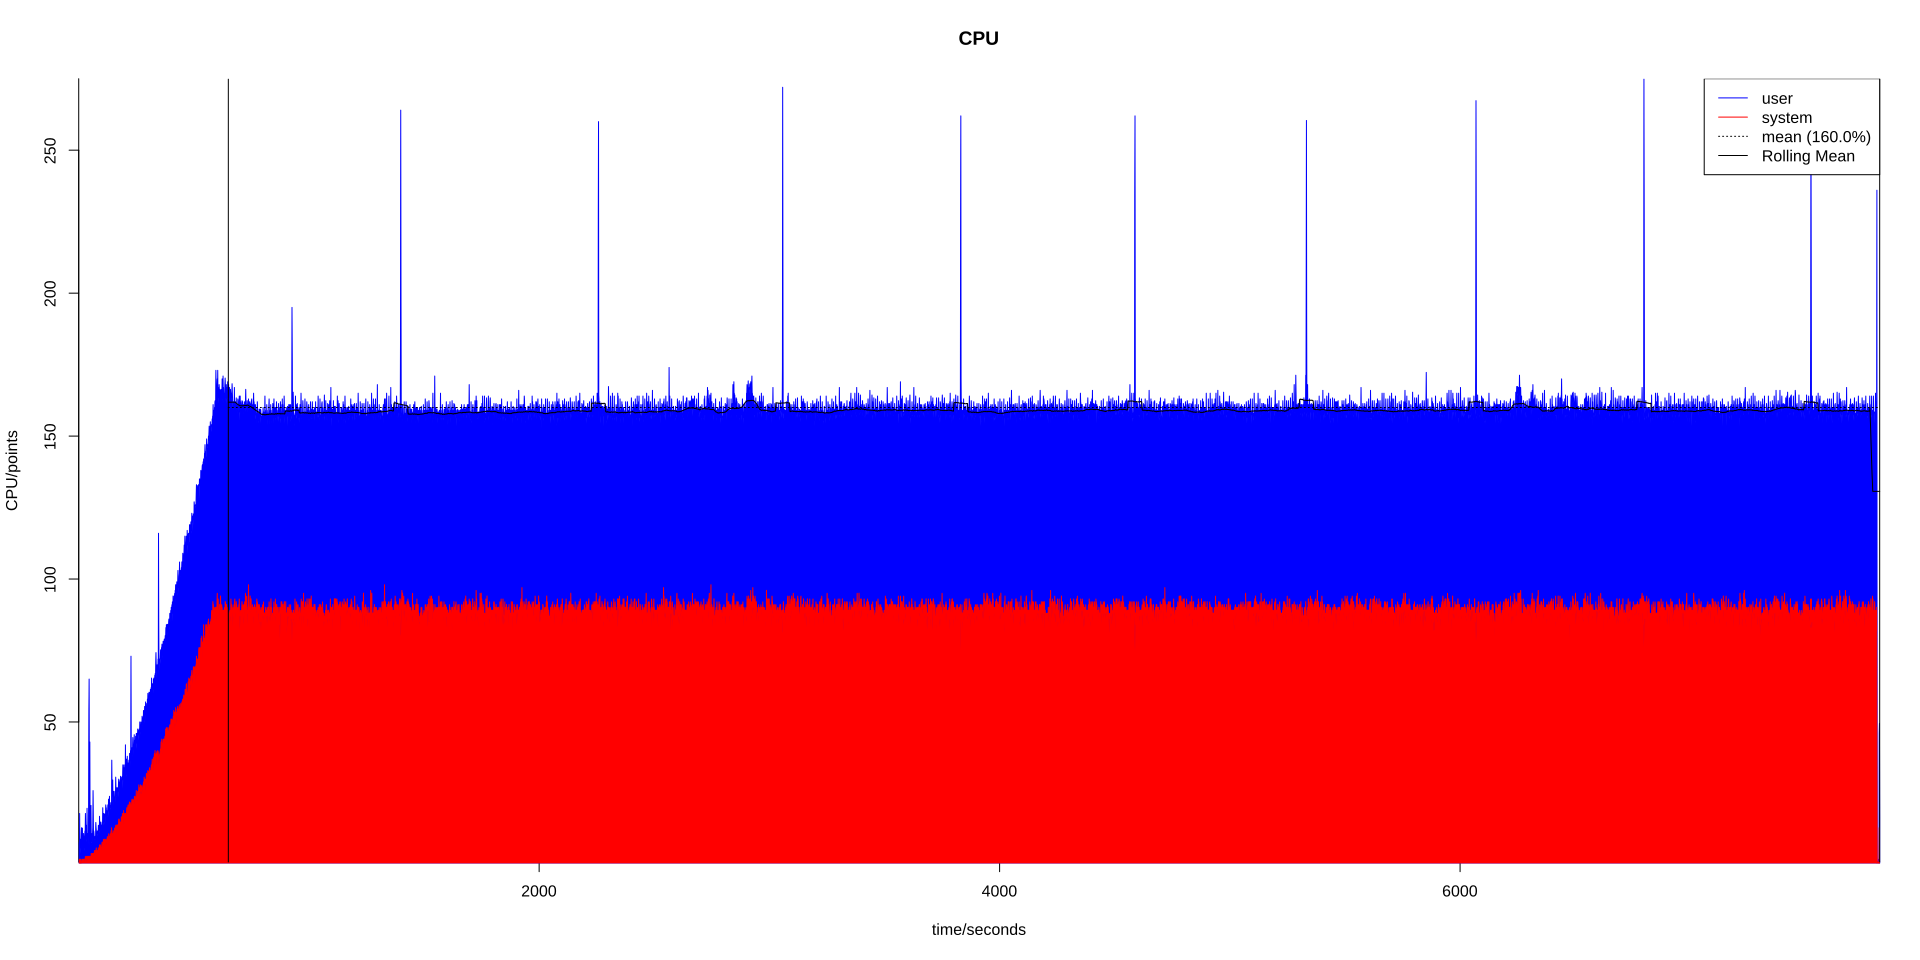
20000 calls per second (40000 messages per second) |
|
CAP Call Monitoring scenario
This page summarises the results for benchmarks executed with the CAP Call Monitoring scenario. Detailed metrics follow the summary tables.
The CAP call monitoring scenario description has more information on how these configurations are defined.
Benchmarks
|
6000 calls per second (24000 messages per second) |
|||||||||||||
|
|||||||||||||
|
|||||||||||||
|
MAP SRI for SM scenario
This page summarises the results for benchmarks executed with the MAP SRI for SM scenario. Detailed metrics follow the summary tables.
The MAP SRI for SM scenario description has more information on how these configurations are defined.
Benchmarks
|
20000 calls per second (40000 messages per second) |
|||||||||||
Maximum theoretical CPU usage is 1600% |
|||||||||||
|
|||||||||||
|
