Below is an overview of how we test CGIN performance, followed by links to the benchmarks.
About the CGIN test scenario
To test the CGIN performance we use a Virtual Private Network (VPN) application, which:
-
provides number-translation and call-barring services for groups of subscribers
-
uses CAPv3 and INAP CS1 protocols for call-control, and MAPv3 for location information
-
uses OpenCloud’s CGIN APIs and resource adaptor to provide CAP and MAP support.
OpenCloud developed this VPN application to meet genuine business requirements from a Tier-1 network operator, giving us genuine benchmarks — instead of, for example, using a trivial demo application.
This test application performs functions that are common to many real-world IN applications:
-
monitoring the entire call, and reliably maintaining state for the duration of the call
-
interacting with external systems (MSC, HLR, call detail records)
-
supporting a large subscriber database.
The VPN Application
The VPN application provides number-translation and call-barring services for groups of subscribers. It uses CAPv3 for call-control and MAPv3 for location information.
| If the A party… | then VPN responds with: |
|---|---|
|
…has called a B party in their own VPN using short code or public number |
|
|
…and B party are not in the same VPN |
|
|
…dials a short code that doesn’t exist |
|
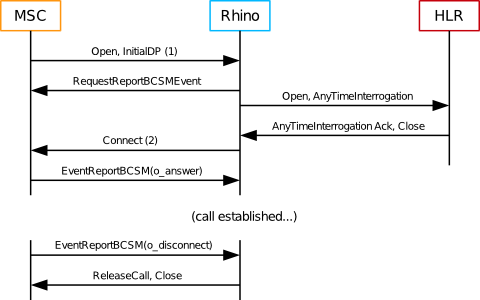
Call flow
The VPN application applies incoming call-screening and outgoing call-screening rules, some of which require location information and involve a MAP query of the HLR.
| |
Measuring call setup time
|
CGIN Benchmark Environment and Configuration
Below are the hardware, software, and Rhino configuration used for the IN benchmarks.
Hardware


Hardware specifications
| Machine | CPUs | Hardware threads | RAM | OS |
|---|---|---|---|---|
|
Rhino node 1 |
2 x 6-core Xeon X5650 2.67GHz |
24 |
24G |
RHEL 7 |
|
Rhino node 2 |
2 x 6-core Xeon X5650 2.67GHz |
24 |
24G |
RHEL 7 |
|
SGC cluster 1 |
2 x 6 core Xeon X5660 2.8GHz |
24 |
32G |
Centos 7 |
|
SGC cluster 2 |
2 x 6 core Xeon X5660 2.8GHz |
24 |
32G |
Centos 7 |
|
Simulator host 1 |
2 x 6 core Xeon X5660 2.8GHz |
24 |
36G |
RHEL 6 |
|
Simulator host 2 |
2 x 6 core Xeon X5660 2.8GHz |
24 |
36G |
RHEL 6 |
Software
The CGIN benchmark tests used the following software.
| Software | Version |
|---|---|
|
Java |
JDK 1.8.0_60 |
|
Rhino |
Rhino 2.5.0.1 |
|
CGIN |
2.0.0.0 |
|
CGIN VPN |
2.0.0.0 |
|
CGIN Back End |
Rhino configuration
For the CGIN benchmark tests, we made the following changes to the Rhino 2.5 default configuration.
| Parameter | Value | Note |
|---|---|---|
|
TCAP stack |
OCSS7 |
|
|
JVM Architecture |
64bit |
Enables larger heaps |
|
Heap size |
8192M |
|
|
New Gen size |
256M |
Increased from default of 128M to achieve higher throughput without increasing latency |
|
Staging queue size |
5000 |
Increased from default of 3000 to allow burst traffic |
|
Staging threads |
150 |
Increased from default of 30 for reduced latency at high throughput |
|
CGIN RA tcap-fibers.max-pool-size |
10 |
Increased from default of 4 for reduced latency at high throughput |
|
CGIN RA tcap-fibers.queue-size |
5000 |
Increased from default of 250 to allow load spikes without processing falling back to incoming thread |
|
CGIN RA ocss7.trdpCapacity |
850000 |
Increased from default of 100000 as required to allow sufficient inflight calls |
|
CGIN RA ocss7.schNodeListSize |
850000 |
Set from default autosize to match ocss7.trdpCapacity |
|
Local Memory DB size |
200M |
Increased from default of 100M to allow more in-flight calls |
Results
Please review the CGIN benchmark results.
CGIN Benchmark Results
Summary
| Cluster size | Call Rate | Event Rate | TCAP message Rate | Results |
|---|---|---|---|---|
|
One node |
8,000 |
36,000 events/s |
64,000 messages/s |
|
|
Two nodes |
15,000 |
67,500 events/s |
120,000 messages/s |
Notes
Below are notes about the test procedure, types of graphs in the results, and how to calculate the number of dialogs per second.
Test procedure
Test calls:
-
were evenly distributed between all available cluster nodes
-
had originating and terminating treatment
-
were monitored for the entire duration on the originating leg
-
lasted 60s.
10% of calls involved a MAP query.
Types of graphs
The individual test results include the following types of graphs:
Response Times |
Distribution of response-time changes during the course of the test run. |
|---|---|
Response Time Distribution |
Overall distribution of response times from the entire test run. |
CPU Utilization |
Percentage of CPU used by Rhino nodes, as reported by the kernel. |
Heap |
Heap usage. |
Calculating number of dialogs
To calculate the number of dialogs (for example, using 8,000 calls per second):
-
All calls involve originating and terminating treatment (in our example, this means 16,000 dialogs).
-
10% of calls involve a query to the HLR (800 dialogs).
…for a total of 16,800 dialogs per second.


